Anatomy of a Bubble
As mentioned previously, I did fine foreseeing the three bear markets in 1987, 1990 and 2000 and missed the one in 2008.
I’ll address 2008 in a bit, but what led me to forecast the Tech sector–led bear market in March 2000 were worrisome realities I felt others were missing. Seeing something dreadful others miss is the basis of a successful bear hunt.
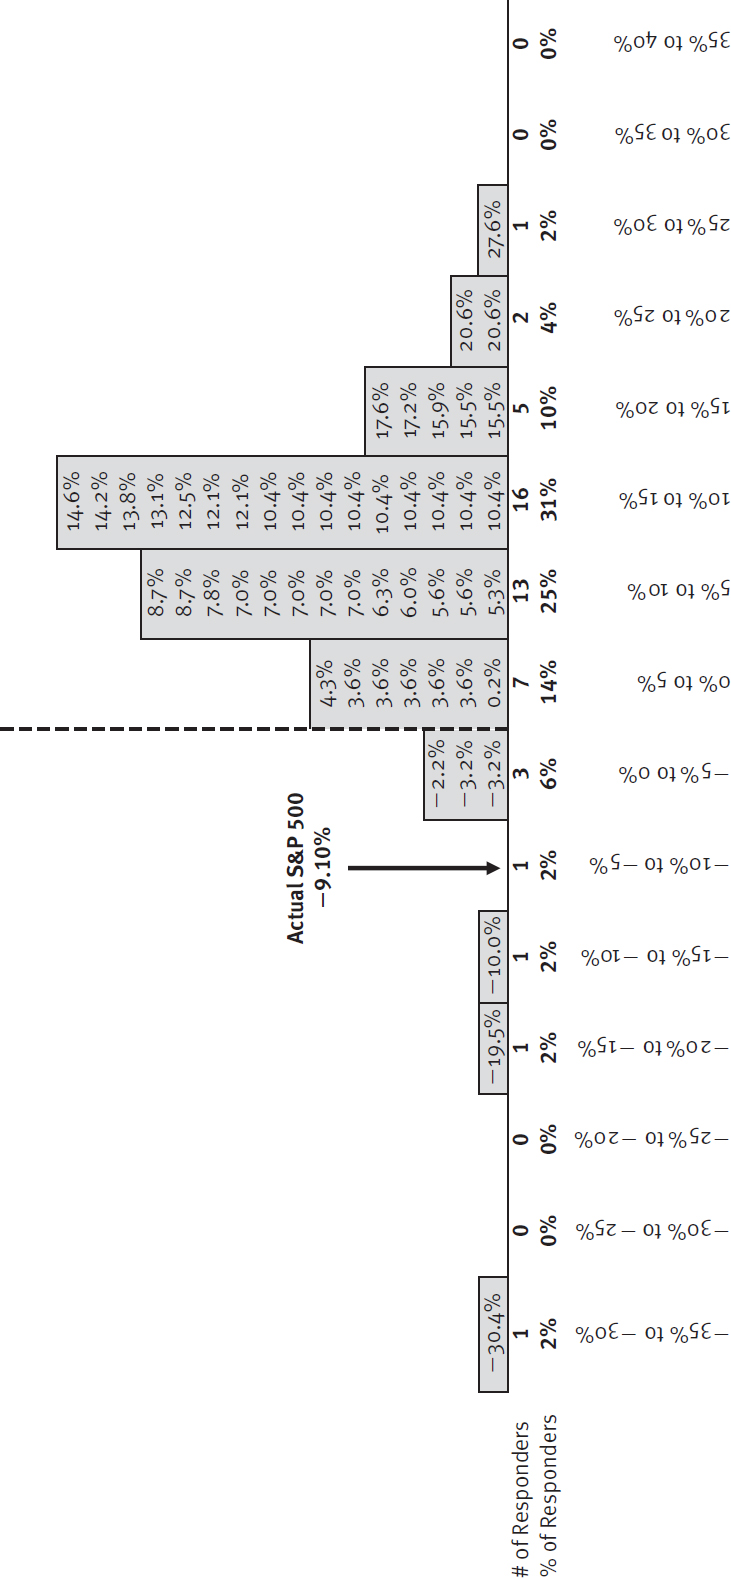
Pros were too bearish, expecting negative or single-digit returns, in 1996, 1997, 1998 and 1999 as US stocks exceeded 20% each and every year. The consensus finally turned strongly bullish in 2000, as measured by my sentiment-based bell curves (which, you recall, were still little utilized then and therefore still had considerable power), agreeing the market would break the 10% mark. (The 2000 bell curve is shown again in Figure 8.2.)
Figure 8.2 The Sentiment Bell Curve Shifts to the Right (S&P 500 Forecast 2000)
Source: BusinessWeek.

I knew I could rule out anything under the consensus bell—from flat to up 20%. I was left with the possibility of an up-a-lot year and two holes on the bearish side, either down a little or a lot. I wouldn’t turn bearish just to be a contrarian. But I was concerned about an inverting yield curve because no one talked about it. As you know, inverted yield curves are fairly reliable predictors of bear markets and recessions (if few notice them)—and it was happening globally. But no ...
Get The Only Three Questions That Still Count: Investing By Knowing What Others Don't, 2nd Edition now with the O’Reilly learning platform.
O’Reilly members experience books, live events, courses curated by job role, and more from O’Reilly and nearly 200 top publishers.

