What the Yield Curve Is Trying to Tell You
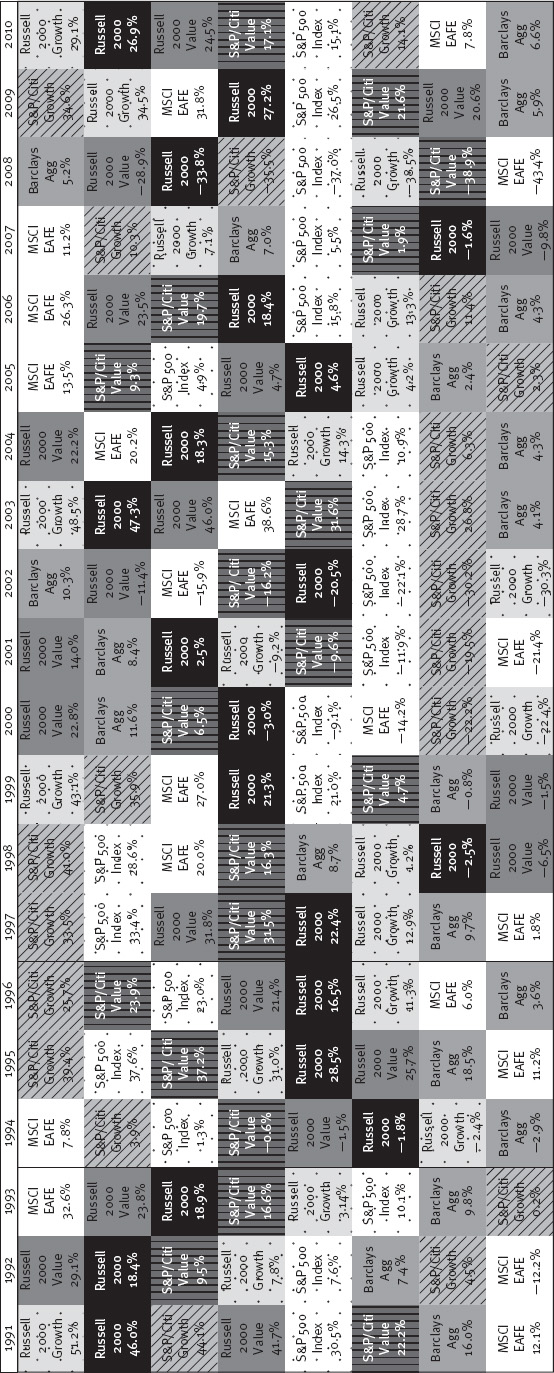
Now you’re thinking about yield curves correctly and can begin looking for other remarkable patterns and another basis for a market bet. Another Question Two: What is it the yield curve can tell you about stocks no one else knows? By now, you know (or you should know if you don’t) all investment styles cycle in and out of favor. We talk more about why in later chapters, but you’ve probably seen something akin to Figure 2.5, which shows changes in leadership among equity sizes and styles.
What Figure 2.5 shows is no one size or style leads for all time. More noticeably, no predictable pattern exists to indicate which size or style will lead next. If you buy the previous year’s winner, you very often end up with this year’s loser—except for an unusual lengthy period of leadership in the late 1990s for large-cap US stocks. Of course, you were then rewarded for your heat chasing with a long period of miserable performance starting in 2000 (as I said, styles pretty much are never hot for 10 years).
If a pattern existed indicating when to change equity categories, how could all the smart people who’ve been investing through all these years have missed it?
Pretty easily.
Figure 2.6 is similar to Figure 2.4—demonstrating not the global yield curve but its spread between the short-term ...
Get The Only Three Questions That Still Count: Investing By Knowing What Others Don't, 2nd Edition now with the O’Reilly learning platform.
O’Reilly members experience books, live events, courses curated by job role, and more from O’Reilly and nearly 200 top publishers.


