Skip to Content
Transportation Statistics and Microsimulation
book

Transportation Statistics and Microsimulation

by Clifford Spiegelman, Eun Sug Park, Laurence R. Rilett
April 2016
Intermediate to advanced
384 pages
11h 9m
English
Chapman and Hall/CRC
Content preview from Transportation Statistics and Microsimulation
16   ◾    Transportation Statistics and Microsimulation
nonparametric density curve. e normal density curve is dotted and the
smoothed density is solid. e nonparametric density estimate is much
smoother than the histogram and may do a better job of showing the
nature of the probability model underlying the data. We will discuss how
we can test statistically whether a given set of data follow a particular pdf
in Chapter 9.
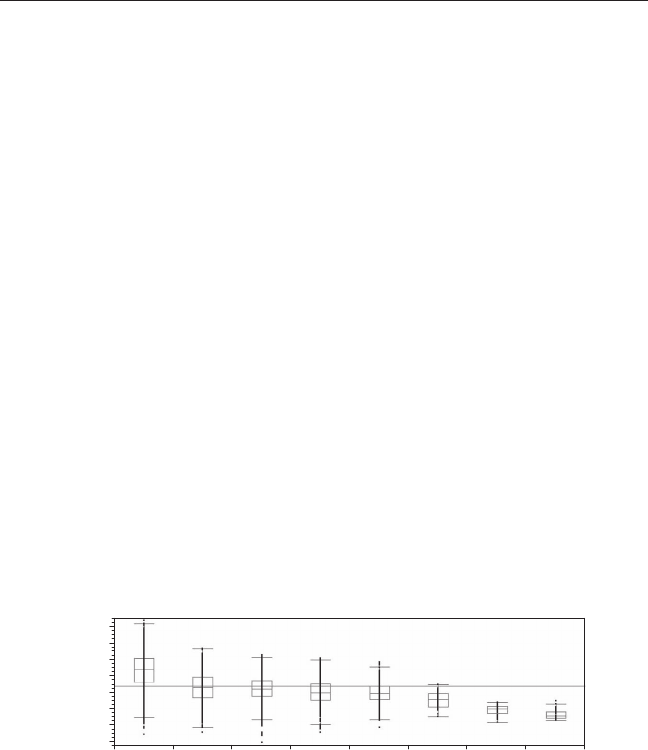
2.3 BOX AND WHISKER PLOT
e next plot that we consider is the box and whisker plot. is plot gives
a quick view of many essential features of a data set; in particular, the box
and whisker plot is useful for identifying ...
Become an O’Reilly member and get unlimited access to this title plus top books and audiobooks from O’Reilly and nearly 200 top publishers, thousands of courses curated by job role, 150+ live events each month,
and much more.
Start your free trial

You might also like

Urban Transportation and Logistics

Urban Transportation and Logistics

Eiichi Taniguchi, Tien Fang Fwa, Russell G. Thompson
What Employees Want Most in Uncertain Times

What Employees Want Most in Uncertain Times

Kristine W. Powers, Jessica B.B. Diaz

Publisher Resources

ISBN: 9781439894545