June 2008
Beginner to intermediate
440 pages
11h 56m
English
There are a handful of key statistics used to describe linear regressions. Two of these define the line itself: The slope (beta) and y-intercept (alpha). Some statistics describe the “fit” or explanatory power of the model: r (correlation coefficient) and R-squared (the coefficient of determination). Other important statistics measure the precision or reliability of the model and its estimates under normal conditions, such as standard errors and t-statistics.
We use the calculation of a stock's beta, per the traditional CAPM approach, to estimating cost of equity, to frame our discussion of the key statistical measures related to linear regression analysis.
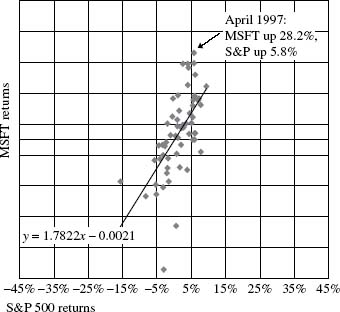
Figure 27.1 Microsoft (MSFT) vs. S&P 500 Index returns: Jan '96–Dec '00
Figure 27.1 shows monthly Microsoft returns (on the vertical y-axis) plotted against monthly total returns of the S&P 500 Index (on the horizontal x-axis). It is common practice in regression analysis to present the dependent variable on the y-axis and the independent variable on the x-axis. Keep in mind that a regression equation only captures the degree of common variation among variables; correlation does not ...
Read now
Unlock full access


