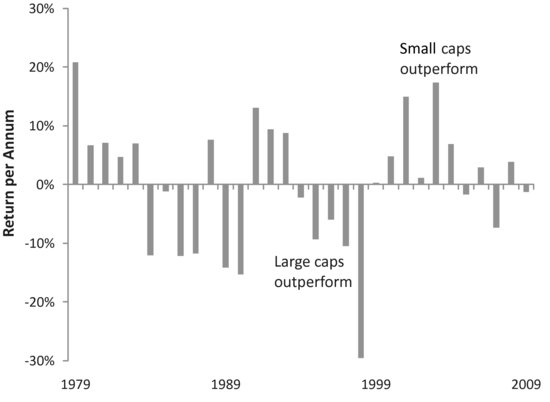
RELATIVE PERFORMANCE OF LARGE-CAP AND SMALL-CAP STOCKS—RUSSELL SERIES
Over the 30 years since the Russell indexes began, small- and large-cap stocks have fluctuated widely relative to one another. Figure 3.1 compares the returns on the Russell 1000 and 2000 indexes by showing the yearly excess return on small caps (defined as the Russell 2000 return minus the Russell 1000 return). In some years, small caps outperform large caps by 10 percent or more. In other years, large caps shine. In 1998, large caps outperformed small caps by almost 30 percent. Overall, however, there seems no clear winner. So there doesn’t appear to be a small-cap premium.
This impression is confirmed in Table 3.4 where we summarize the long-run performance over the 30 years as a whole. Both geometric (compound) averages and arithmetic averages are reported for the period from 1979 through December 2009. The compound geometric return on large caps is actually higher than that on small caps, 11.5 percent versus 11.3 percent. Using arithmetic averages, small caps have the higher average return, but the two returns are still very close to one another.8
TABLE 3.4 Returns for Russell Large-Cap, Small-Cap, and Small-/Mid-Cap Stocks, 1979–2009
Data Source: RussellR©.
Table 3.4 also reports the (annualized) standard deviations ...
Get Portfolio Design: A Modern Approach to Asset Allocation now with the O’Reilly learning platform.
O’Reilly members experience books, live events, courses curated by job role, and more from O’Reilly and nearly 200 top publishers.


