August 2017
Intermediate to advanced
288 pages
8h 6m
English
Let's look at the distribution of features for the occupation data:
> ggpairs(occupancy_train$data[, occupancy_train$xFeatures])
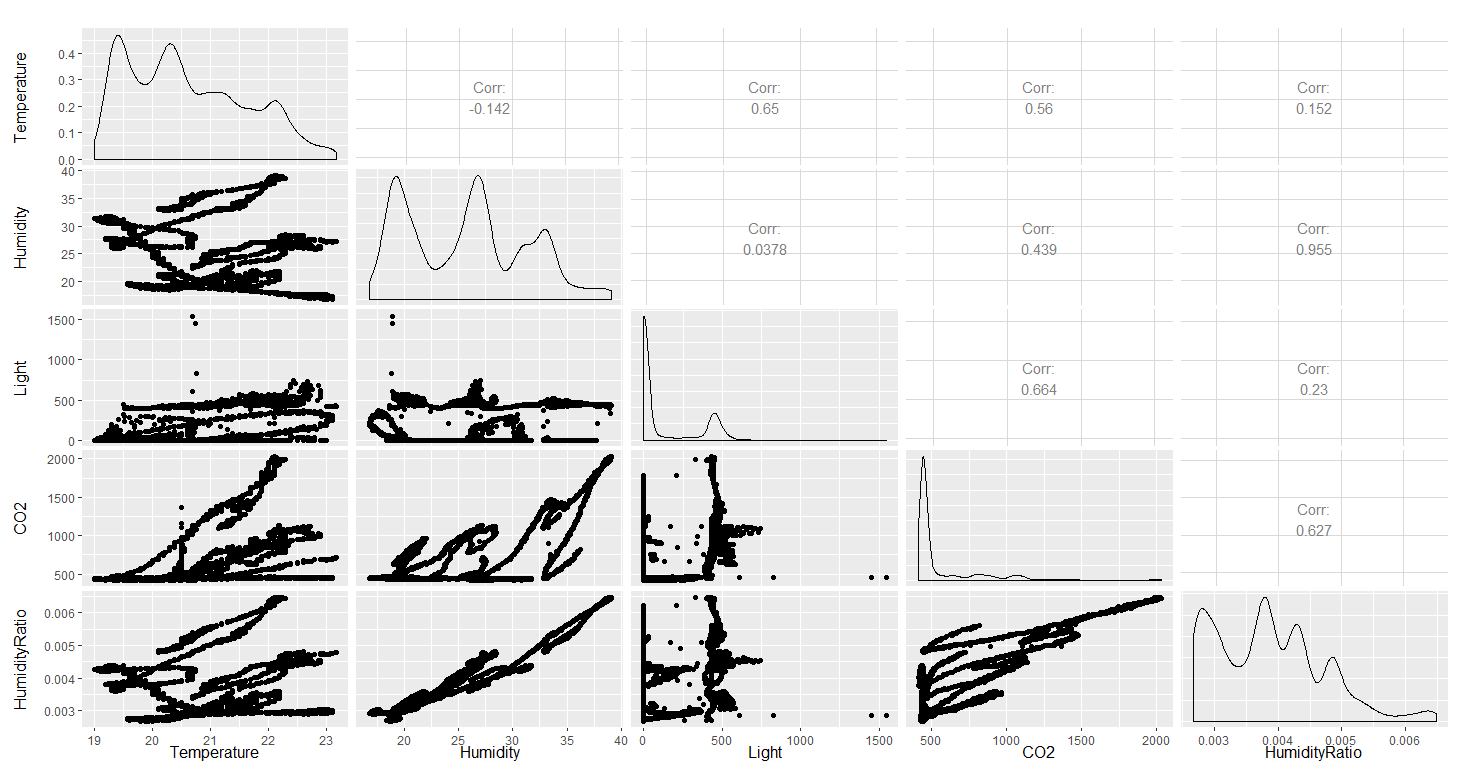
The figure shows that the features have linear correlations and the distributions are non-normal. The non-normality can be further validated using the Shapiro-Wilk test, using the shapiro.test function from R. Let's use min-max standardization for the occupation data.