December 2018
Intermediate to advanced
188 pages
4h 2m
English
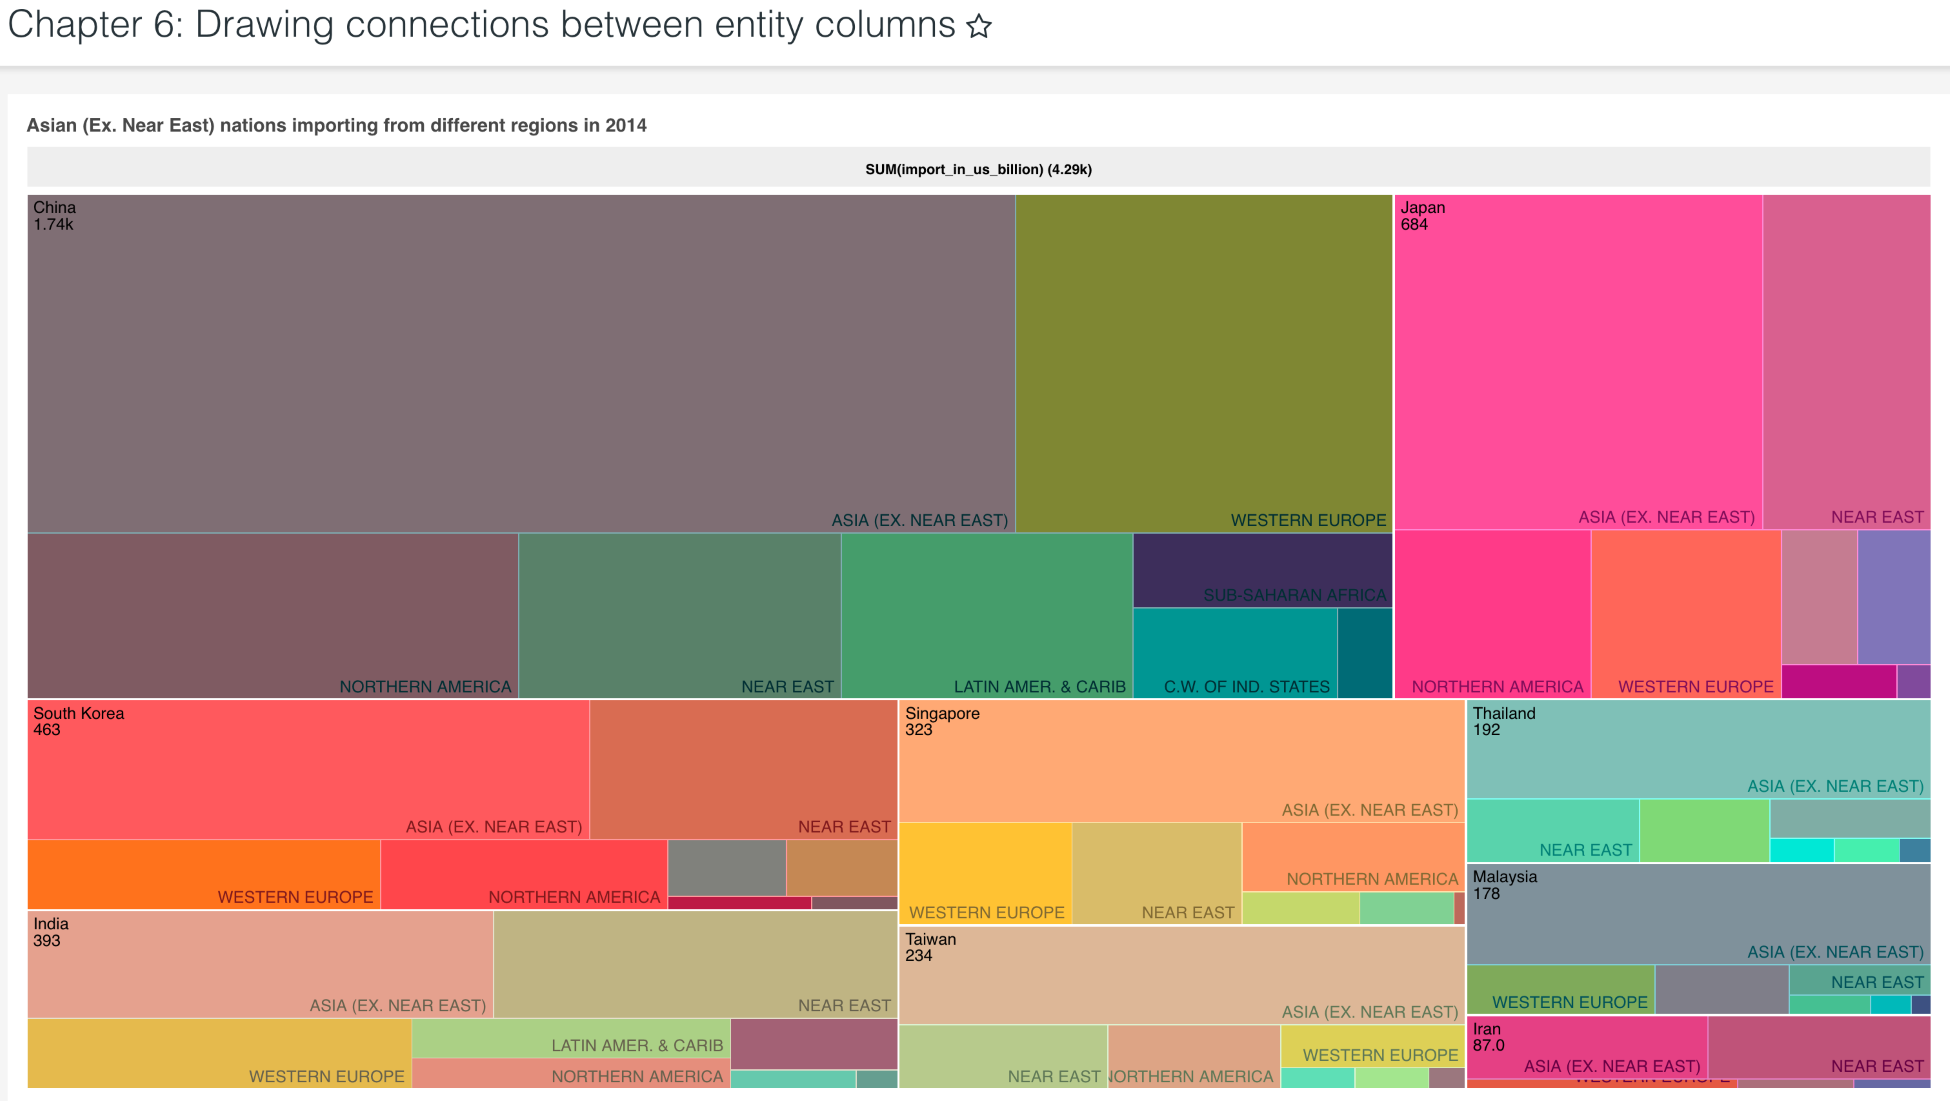
The trade flow numbers between nations present in the IMF's Direction of Trade Statistics (DOTS) quarterly release dataset were visualized using multiple charts.
Each chart showed differences in trade volumes in USD between nations as entities. Using a Sankeys graph, a sunburst, a chord diagram, and a directed force graph, we looked at different groups of nations and their relative differences in trade volume. TreeMap was effective at showing the breakdown of import volumes in USD for countries, grouped by region:
Read now
Unlock full access


