December 2018
Intermediate to advanced
188 pages
4h 2m
English
Sankey diagrams are flow diagrams where the width of the arrows is shown as proportional to the flow quantity. We will use one to understand from where merchandise goods imported into Western European nations originate. Because the number of nations that export to Western European nations is too large to visualize, we will group trade flow by the geographical regions of the exporting nations:
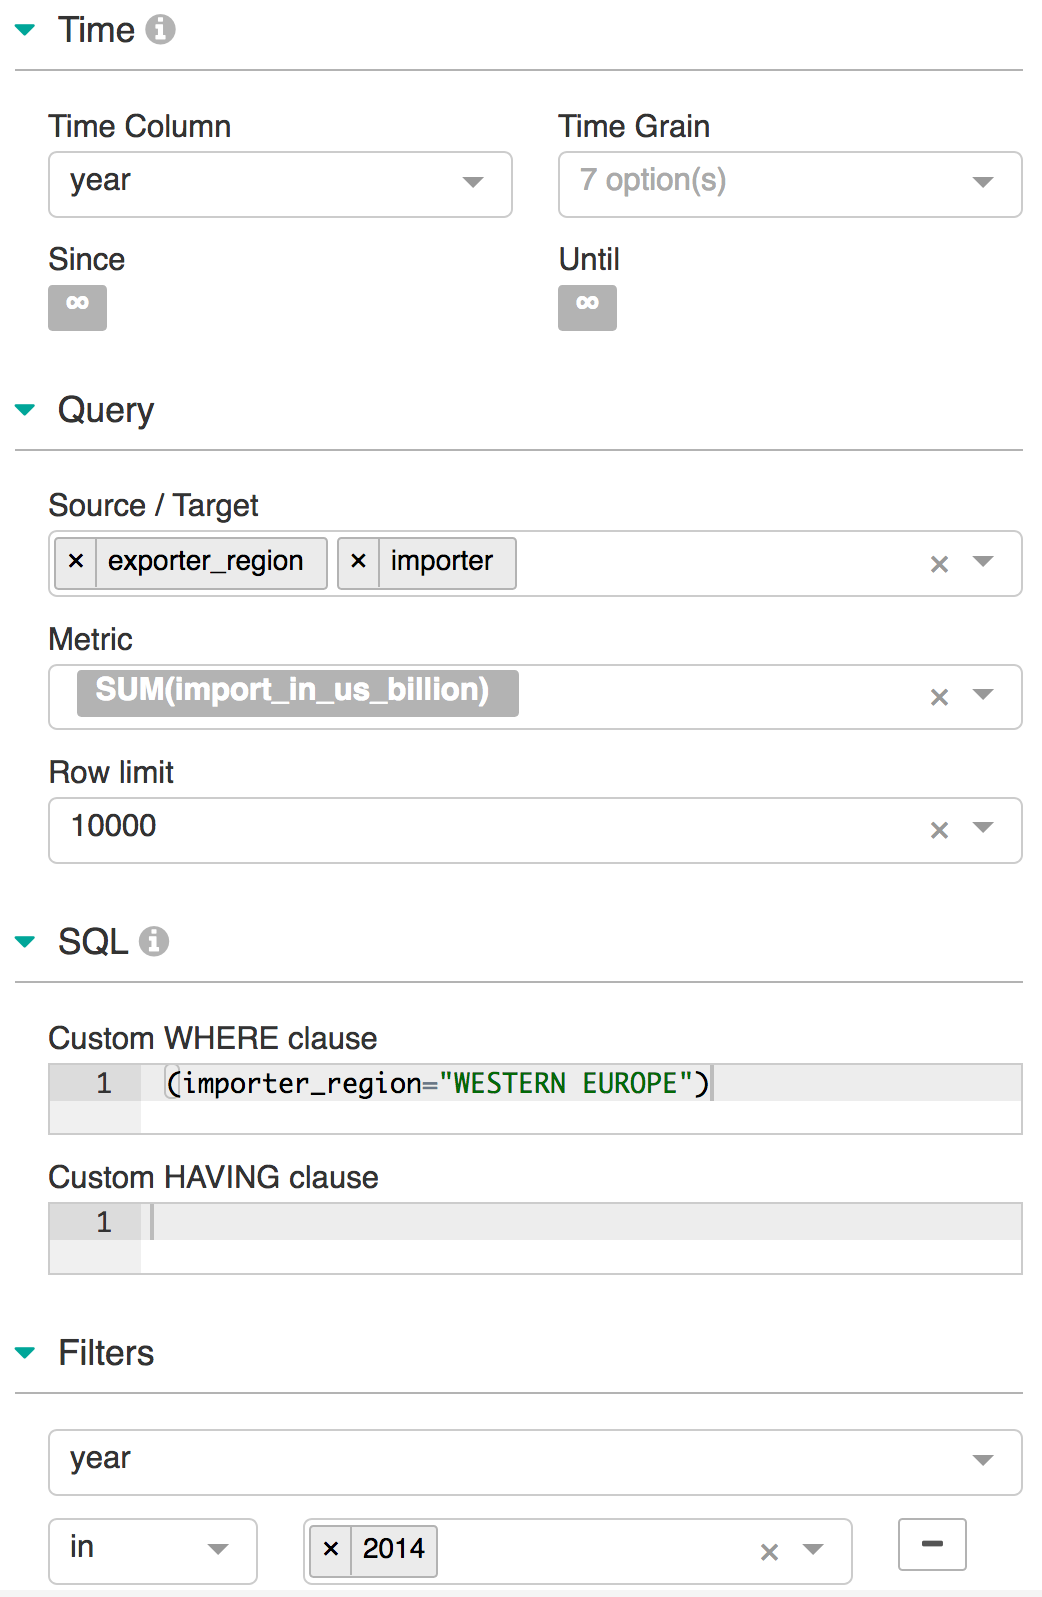
The Since and Until fields in the Time section can be cleared because we will use 2014 as the value in the year column to filter rows in the ...
Read now
Unlock full access


