December 2018
Intermediate to advanced
188 pages
4h 2m
English
In this chapter, we picked the reading log from http://austinrochford.com/ for data analysis.
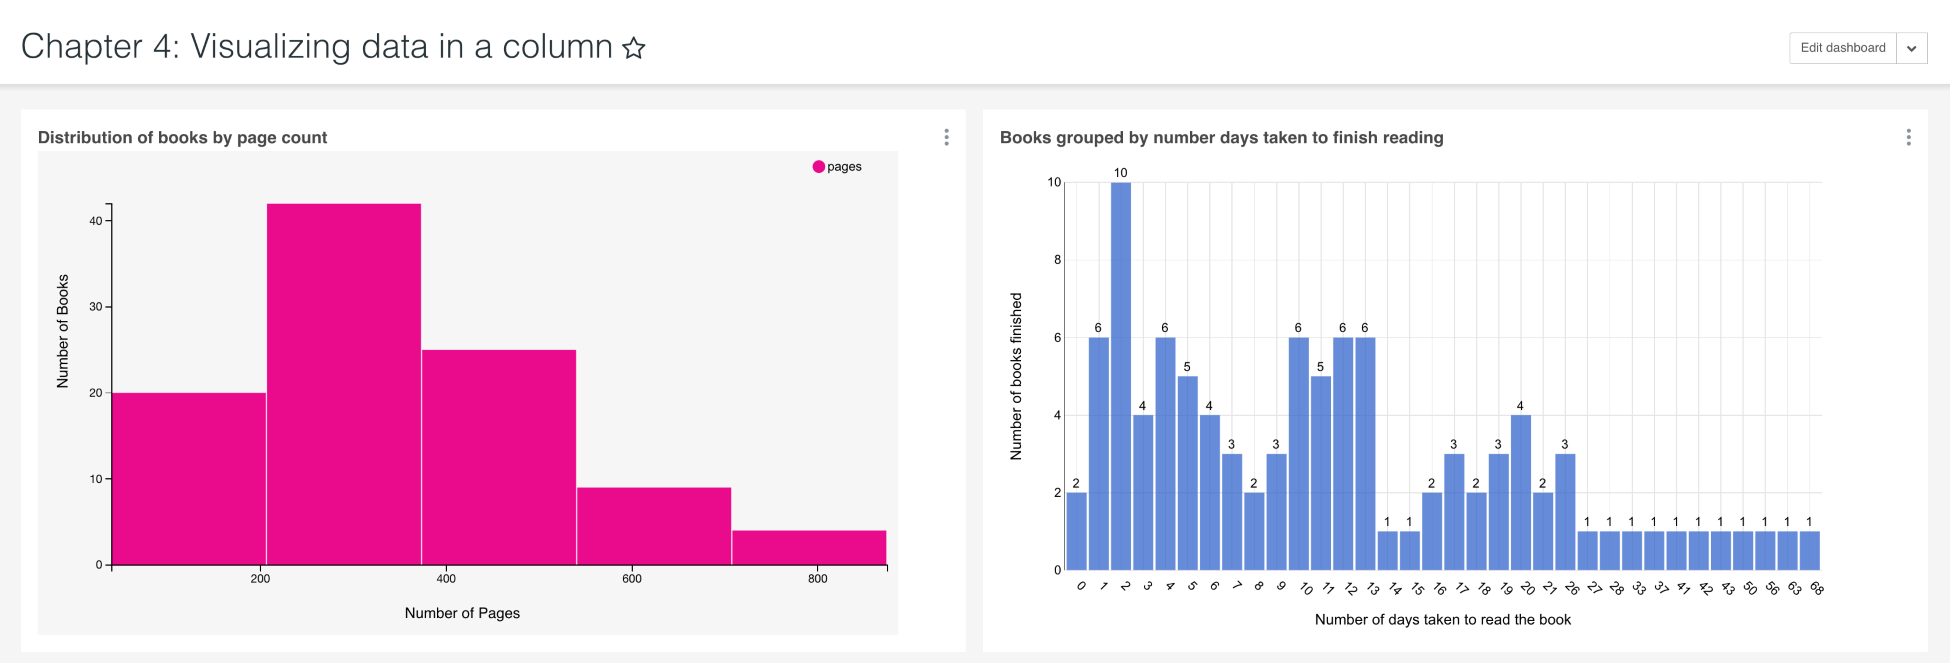
With five charts, we were able to get insights about the page count feature in the time series dataset. The histogram and bar chart provided information about the page count and number of reading days for the books in the dataset. Such charts, when put on a dashboard, provide useful context before analysis:
Box plots and dual axis line charts showed the variance in page count values for different groups of books defined by the number of reading days:
Read now
Unlock full access


