December 2018
Intermediate to advanced
188 pages
4h 2m
English
We have added two charts to our first dashboard. Next, we'll insert a component with which we can place charts on different tabs:
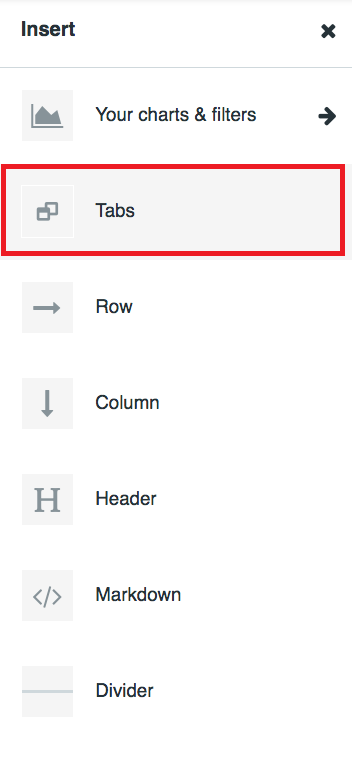
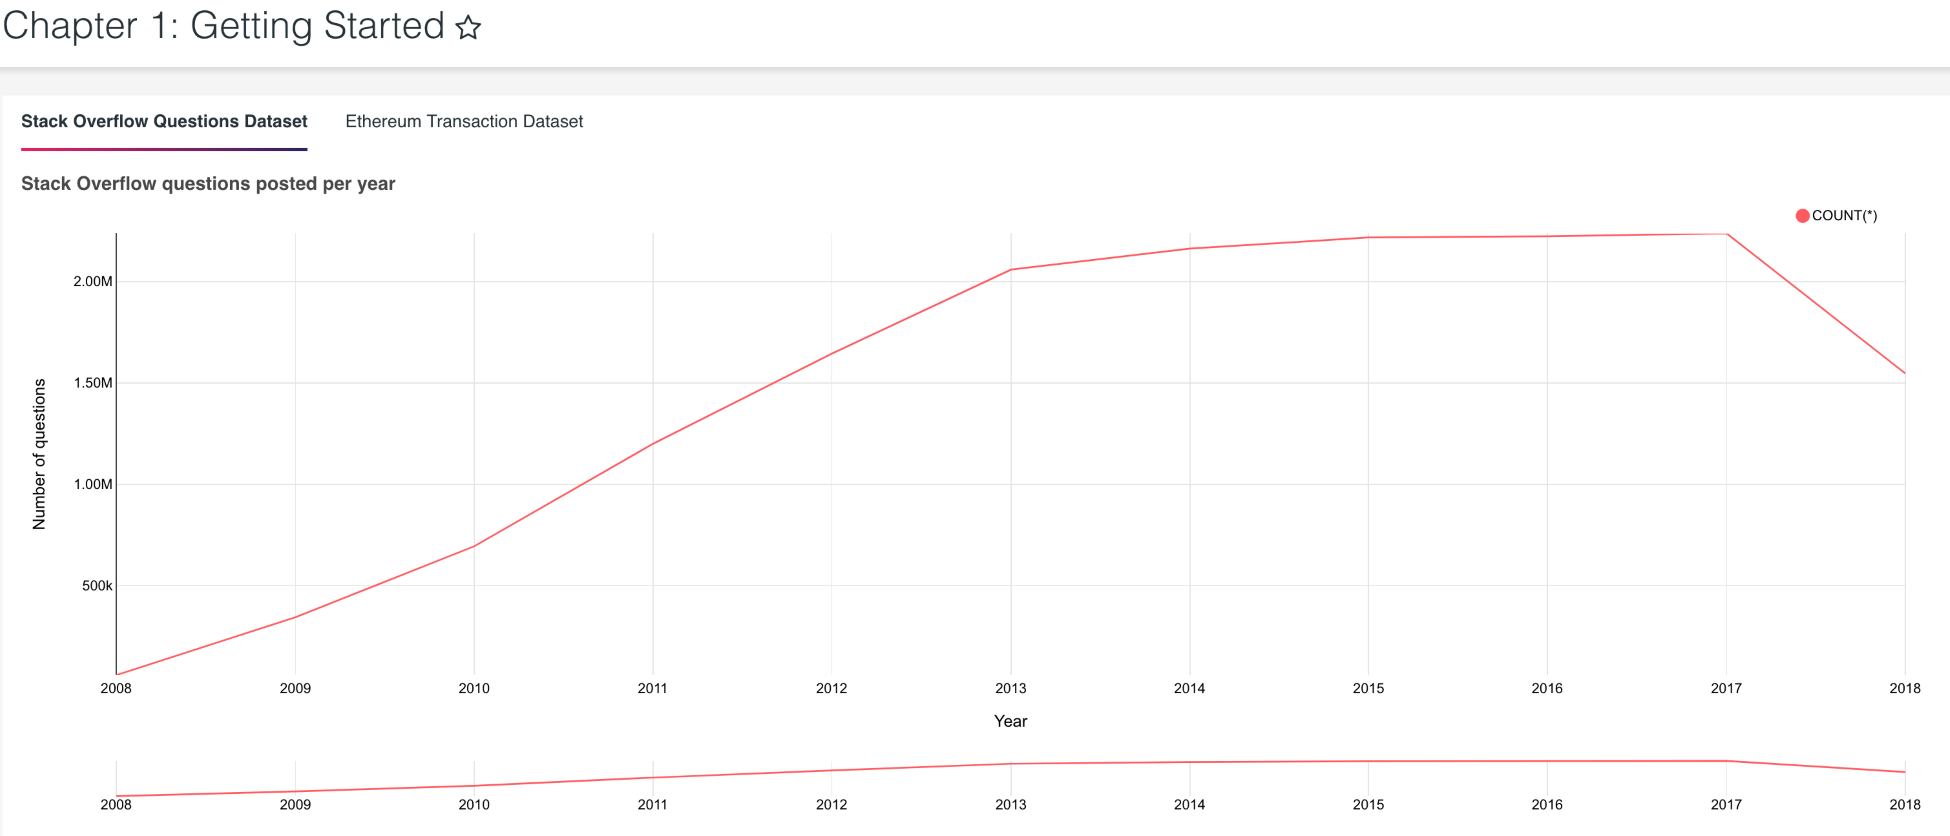
After you insert the Tabs component, just drag and drop the two charts. Once the two charts have been separated, label the tabs with the corresponding dataset names represented in the charts:
Read now
Unlock full access


