December 2018
Intermediate to advanced
188 pages
4h 2m
English
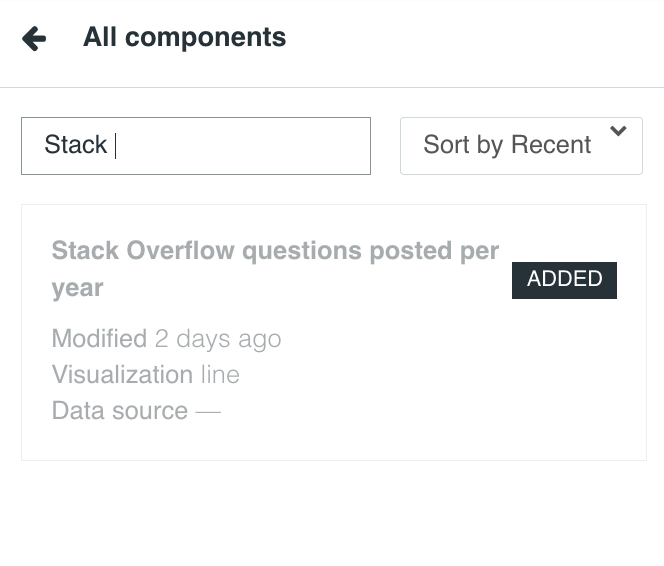
In the edit mode, use the Select charts and filters option to search for the charts that you want to add. For the Chapter 1: Getting Started dashboard, we'll add Stack Overflow questions posted per year:
This is then followed by Ethereum Transaction Volume as the second chart. The charts do not represent insights from the same dataset. It's important therefore that we separate them into two tabs.
Read now
Unlock full access


