July 2015
Intermediate to advanced
106 pages
2h 47m
English
When you have done the second step, you should have a new figure for capacity and time to market. The following diagram shows the result plotted in a graph:
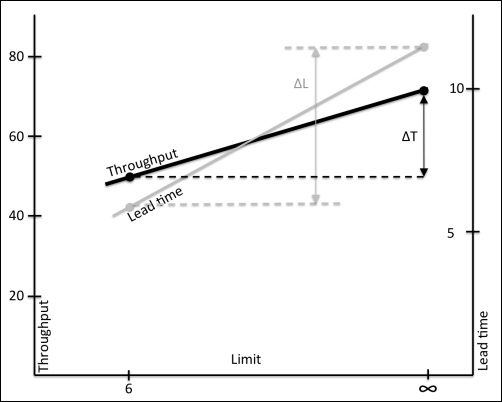
The game's result put in a graph. As you can see, the lead time shrinks more than the throughput when introducing limits.
Theoretically, there should be a big difference in time to market (ΔL) and a small difference in throughput (ΔT). Practically, this is not always the result due to the big variation in personal capacity, 1-6. If you have four teams or more doing this exercise, your average result will most likely get close to the theoretical outcome.
The time to ...
Read now
Unlock full access


