Creating multiple plots
One very useful feature of matplotlib is that it makes it easy to plot multiple plots, which can be compared to each other:
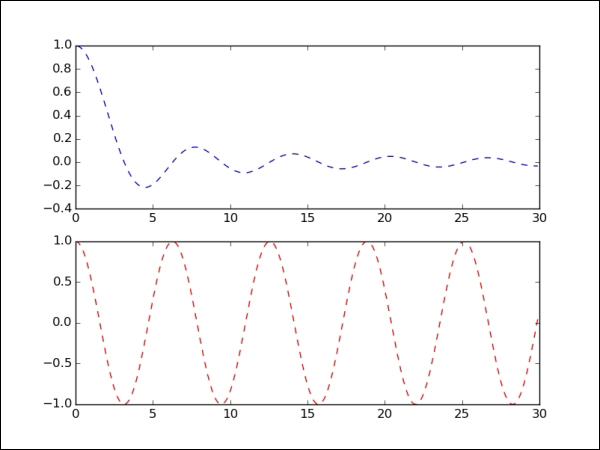
>>> p1 = np.arange(0.0, 30.0, 0.1)

>>> plt.subplot(211)
>>> plt.plot(p1, np.sin(p1)/p1, 'b--')

>>> plt.subplot(212)
>>> plt.plot(p1, np.cos(p1), 'r--')
>>> plt.show()
In the preceding code, we use a subplot function is used to plot multiple plots that need to be compared. A subplot with a value of 211 means that there will be two rows, one column, and one figure:
Get Mastering Python for Data Science now with the O’Reilly learning platform.
O’Reilly members experience books, live events, courses curated by job role, and more from O’Reilly and nearly 200 top publishers.

