Chapter 13. Pivoting Columns to Rows
I grew up in the ’90s, so when I hear the word “pivot,” the image that instantly pops into my brain is the Friends characters trying to get Ross’s sofa up the winding apartment staircase.
We first looked at pivoting data (not sofas in stairwells) in Chapter 4. This chapter will build on that discussion, looking at when and how to pivot columns into rows of data in Prep Builder. This type of data transition is also referred to as transposing.
When to Pivot in Tableau Prep Builder
Tableau Desktop needs the data to be in structured columns. Each column can hold one type of data and can be used on either Desktop shelves or cards to alter the view onscreen. Accordingly, a common use case for pivoting is when you are adding a new column for each new date in a data set (Figure 13-1).
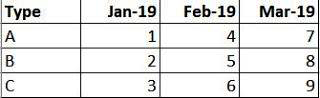
Figure 13-1. Adding a new column per month to the data set
The data structure in Figure 13-2 isn’t great for two reasons. First, if you want the dates displayed on an x-axis timeline, you can’t do that with this structure, because you need one column to hold all the different dates and another column to hold all the relevant values for each of those dates. Second, if the file is updated, Tableau Desktop won’t automatically add the new column into your analysis. If the new data appeared as additional rows instead, it would be included in the view (as long as Desktop is ...
Get Tableau Prep: Up & Running now with the O’Reilly learning platform.
O’Reilly members experience books, live events, courses curated by job role, and more from O’Reilly and nearly 200 top publishers.

