6 BUSINESS APPLICATIONS OF MULTIPLE REGRESSION
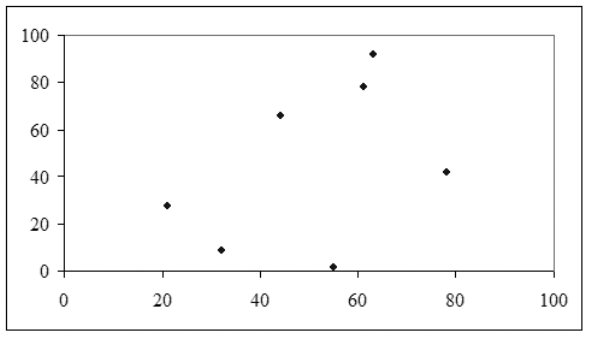
Now take a look at the chart in Figure 1.2. This scatterplot also shows
actual data. This time, it is impossible to imagine a line that would fit the
data. In this case, the data have a very weak correlation.
Terms
Correlation is only able to find, and simple regression and multiple
regression are only able to describe, linear relationships. Figure 1.1 shows
a linear relationship. Figure 1.3 shows a scatterplot in which there is a
perfect relationship between the X and Y variables, only not a linear one
(in this case, a sine wave.) While there is a perfect mathematical relation-
ship between ...


