70 BUSINESS APPLICATIONS OF MULTIPLE REGRESSION
Confidence Interval for Predicted Value
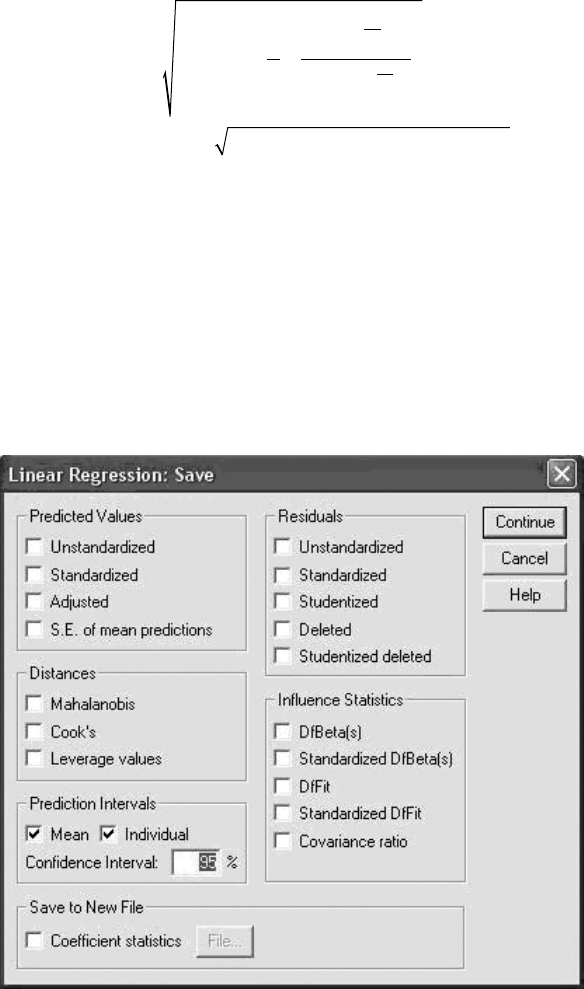
Figure 2.12. Saving the confidence intervals in SPSS.
ˆ
. ,
y t MSE
n
X X
X X
i n
i
i
i
n
± ⋅ + +
−
(
)
−
(
)
⎡
⎣
⎢
⎢
⎢
⎢
−
=
∑
0 05 2
2
2
1
1
1
⎤⎤
⎦
⎥
⎥
⎥
⎥
± ⋅ + +6 578 2 2 0639, . . 21,198.57 1 0.03846 0.2919
[[ ]
±
[ ]
6 578 2 346 6
6 231 6 6 924 8
, . .
, . , , .
Whereas SPSS does not give you the values needed to compute these
confidence intervals, it will compute them for you for all the observations
in the sample. To do this, begin as before and click on Analyze, Regres-
sion, and then Linear, which brings up the dialog box shown in Figure
2.7. From there, click on the Save button. That brings up


