CORRELATION ANALYSIS 39
those are the only values returned by this worksheet tab. Just as in the
hypothesis testing template, these values are not really needed since the
tab for hypothesis testing looks up the values automatically.
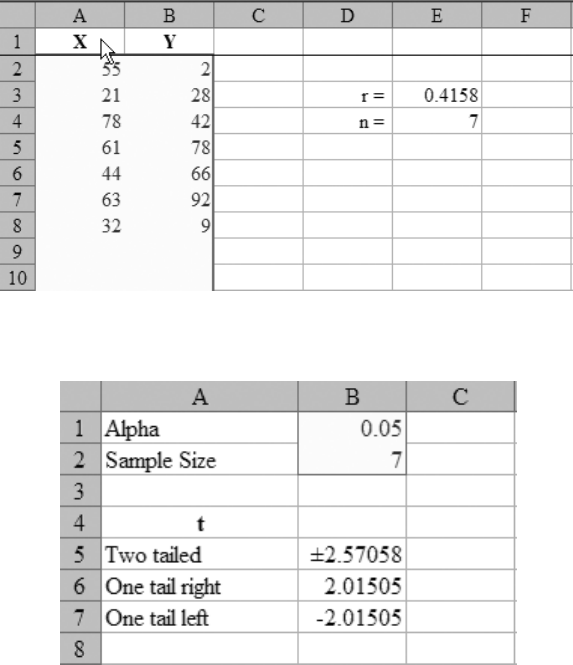
The Hypothesis Test tab of the worksheet is shown in Figure 1.22. This
tab automates much of the hypothesis testing. You enter the alpha level
in cell B2, the correlation coefficient in cell B5, and the sample size in
cell B6. The tab then performs all the calculations. You then simply select
the appropriate hypothesis. In this example, the two- tailed test returns
the test statistic of 1.0223, as computed in the ...


