January 2015
Beginner
480 pages
31h 42m
English
As you have just seen, when looking at events that have already happened, we can summarize them with statistics such as average or mean, variance, and standard deviation. These statistical tools help us understand the history of certain investment choices.
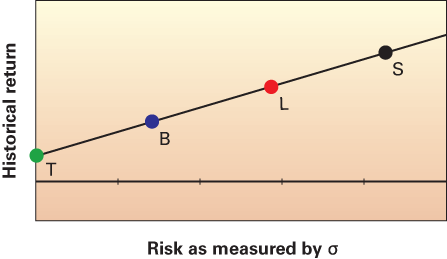
Historical returns and standard deviations of bonds and stocks. T = T reasury bills, B = government bonds, L = large-company stocks, and S = small-company stocks.
The horizontal axis of the graph is labeled Risk as measured by
The vertical axis is labeled Historical return.
Four points (labeled T, ...
Read now
Unlock full access


