8.8 Beta: The Measure of Risk in a Well-Diversified Portfolio

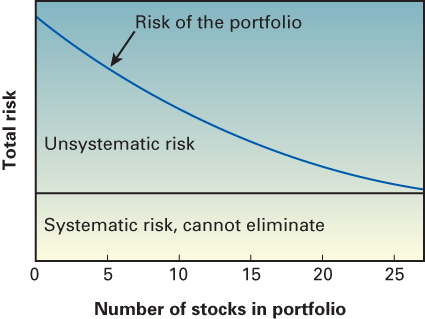
Figure 8.11
Portfolio diversification and the elimination of unsystematic risk.
Description
The horizontal axis of the graph is labeled Number of stocks in portfolio; the vertical axis is labeled Total risk. The numbers 0, 5, 10, 15, 20, and 25 are indicated along the horizontal axis at regular intervals.
A blue line (labeled Risk of the portfolio) is drawn from near the top of the Total risk axis and slopes down and to the right to approximately 28 on the Number of stocks in portfolio axis. At this point, the risk is fairly low.
The line indicates that the total risk of the portfolio ...
Get Financial Management: Core Concepts, Third Edition now with the O’Reilly learning platform.
O’Reilly members experience books, live events, courses curated by job role, and more from O’Reilly and nearly 200 top publishers.

