May 2012
Beginner
88 pages
2h 4m
English
In all the projects in this book, we have been using Visual Studio’s debugger, while at the same time, not actually making use of its features.
The debugger is a very powerful tool for—well, you guessed it—debugging a project. It allows you to set breakpoints where the program will stop and you can inspect the values of variables, then move the program on one line at a time.
As an experiment, we are going to add a breakpoint to the program.
To do this, all we have to do is click on the gray area to the left of the
line of code where we want the program to pause (see Figure 5-4). In this case, on the second line of the CopyFiles method. Note how a big red dot has
appeared next to the line. We can cancel the breakpoint by clicking on
this dot.
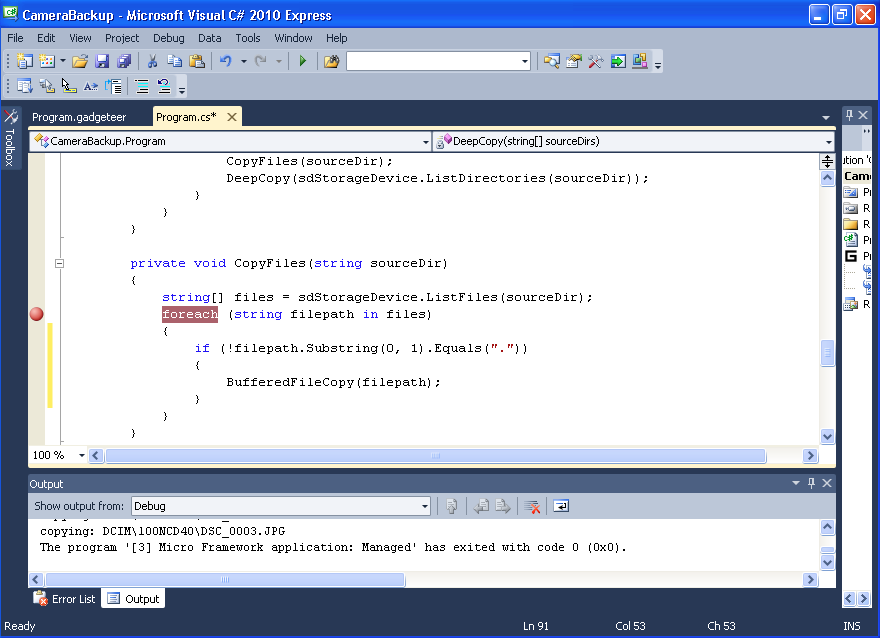
Figure 5-4. Setting a Breakpoint
Click the green play triangle to start the debugger as you normally would when deploying a project. Insert the USB storage device, but not the SD card yet.
It may seem like nothing is different, but actually, we will not get to the breakpoint until file copying begins when the SD card has been inserted, so insert the SD card to trigger the breakpoint.
You should now get to the breakpoint. Notice the change of appearance of the breakpoint dot, shown in Figure 5-5.
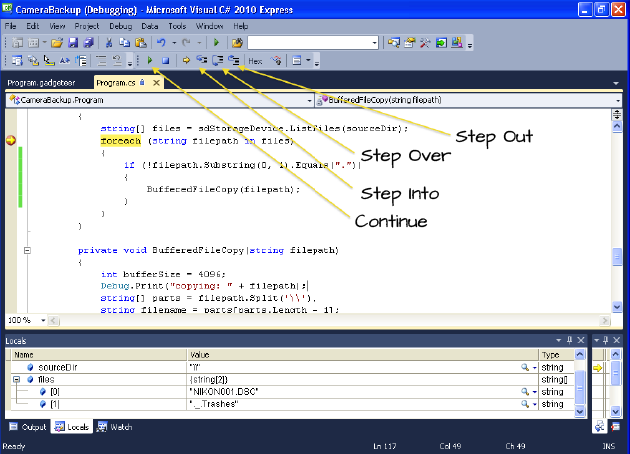
Figure 5-5. Reaching a Breakpoint
If you click ...
Read now
Unlock full access


