November 2019
Intermediate to advanced
304 pages
8h 40m
English
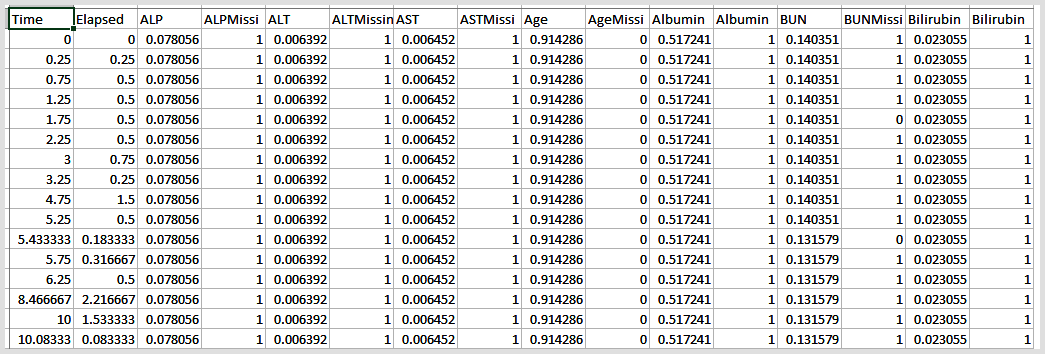
Time series data is three-dimensional. Each sample is represented by its own file. Feature values in columns are measured on different time steps denoted by rows. For instance, in step 1, we saw the following snapshot, where time series data is displayed:

Each file represents a different sequence. When you open the file, you will see the observations (features) recorded on different time steps, as shown here:
The labels are contained in a single CSV file, which contains a value of 0, indicating death, or a value of 1, indicating ...
Read now
Unlock full access


