Visualization methods
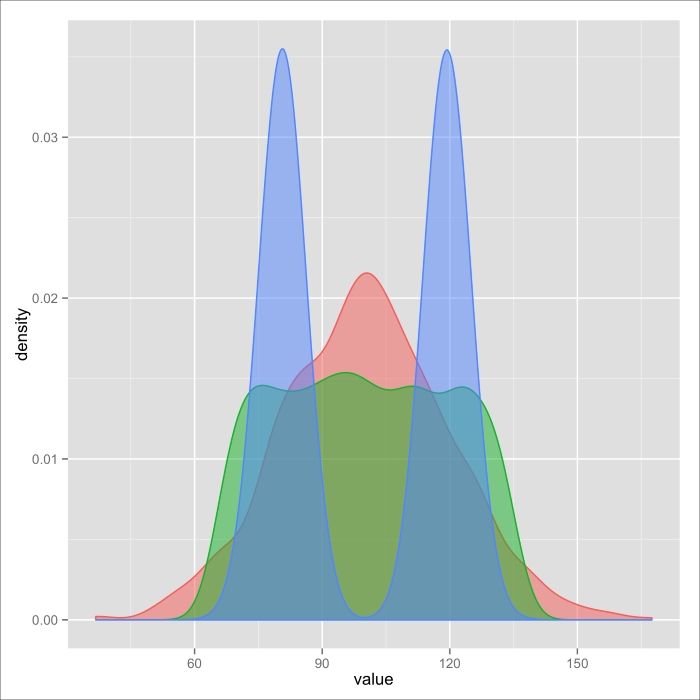
In an earlier image, we saw three very different distributions, all with the same mean and median. I said then that we need to quantify variance to tell them apart. In the following image, there are three very different distributions, all with the same mean, median, and variance.

Figure 2.10: Three PDFs with the same mean, median, and standard deviation
If you just rely on basic summary statistics to understand univariate data, you'll never get the full picture. It's only when we visualize it that we can clearly see, at a glance, whether there are any clusters or areas with a high density of data points, the number of clusters ...
Get R: Data Analysis and Visualization now with the O’Reilly learning platform.
O’Reilly members experience books, live events, courses curated by job role, and more from O’Reilly and nearly 200 top publishers.

