6.3 Probability as An Area Under The Normal Curve
Suppose ![]() is
is ![]() If we are interested in finding
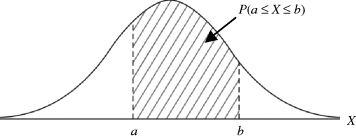
If we are interested in finding ![]() then we can do so by determining the area under the normal density curve from
then we can do so by determining the area under the normal density curve from ![]() (Fig. 6.5).
(Fig. 6.5).
Figure 6.5 Probability as area under ![]() .
.

(Note that when dealing with a continuous univariate probability density function, the notion of an “event” is simply an interval ![]() on the X-axis.) While integral calculus techniques can be applied to find an area under the normal curve, we shall judiciously not attempt to do so. Instead, we shall read the area under the normal curve directly from a table. However, before we do so, let us note that there actually exists an infinite number of potential normal curves—one for each possible (allowable) value for . For instance, as increases in value from fixed, the normal ...
on the X-axis.) While integral calculus techniques can be applied to find an area under the normal curve, we shall judiciously not attempt to do so. Instead, we shall read the area under the normal curve directly from a table. However, before we do so, let us note that there actually exists an infinite number of potential normal curves—one for each possible (allowable) value for . For instance, as increases in value from fixed, the normal ...
Get Statistical Inference: A Short Course now with the O’Reilly learning platform.
O’Reilly members experience books, live events, courses curated by job role, and more from O’Reilly and nearly 200 top publishers.

