This section explains the results of the LSTM model's evaluation.
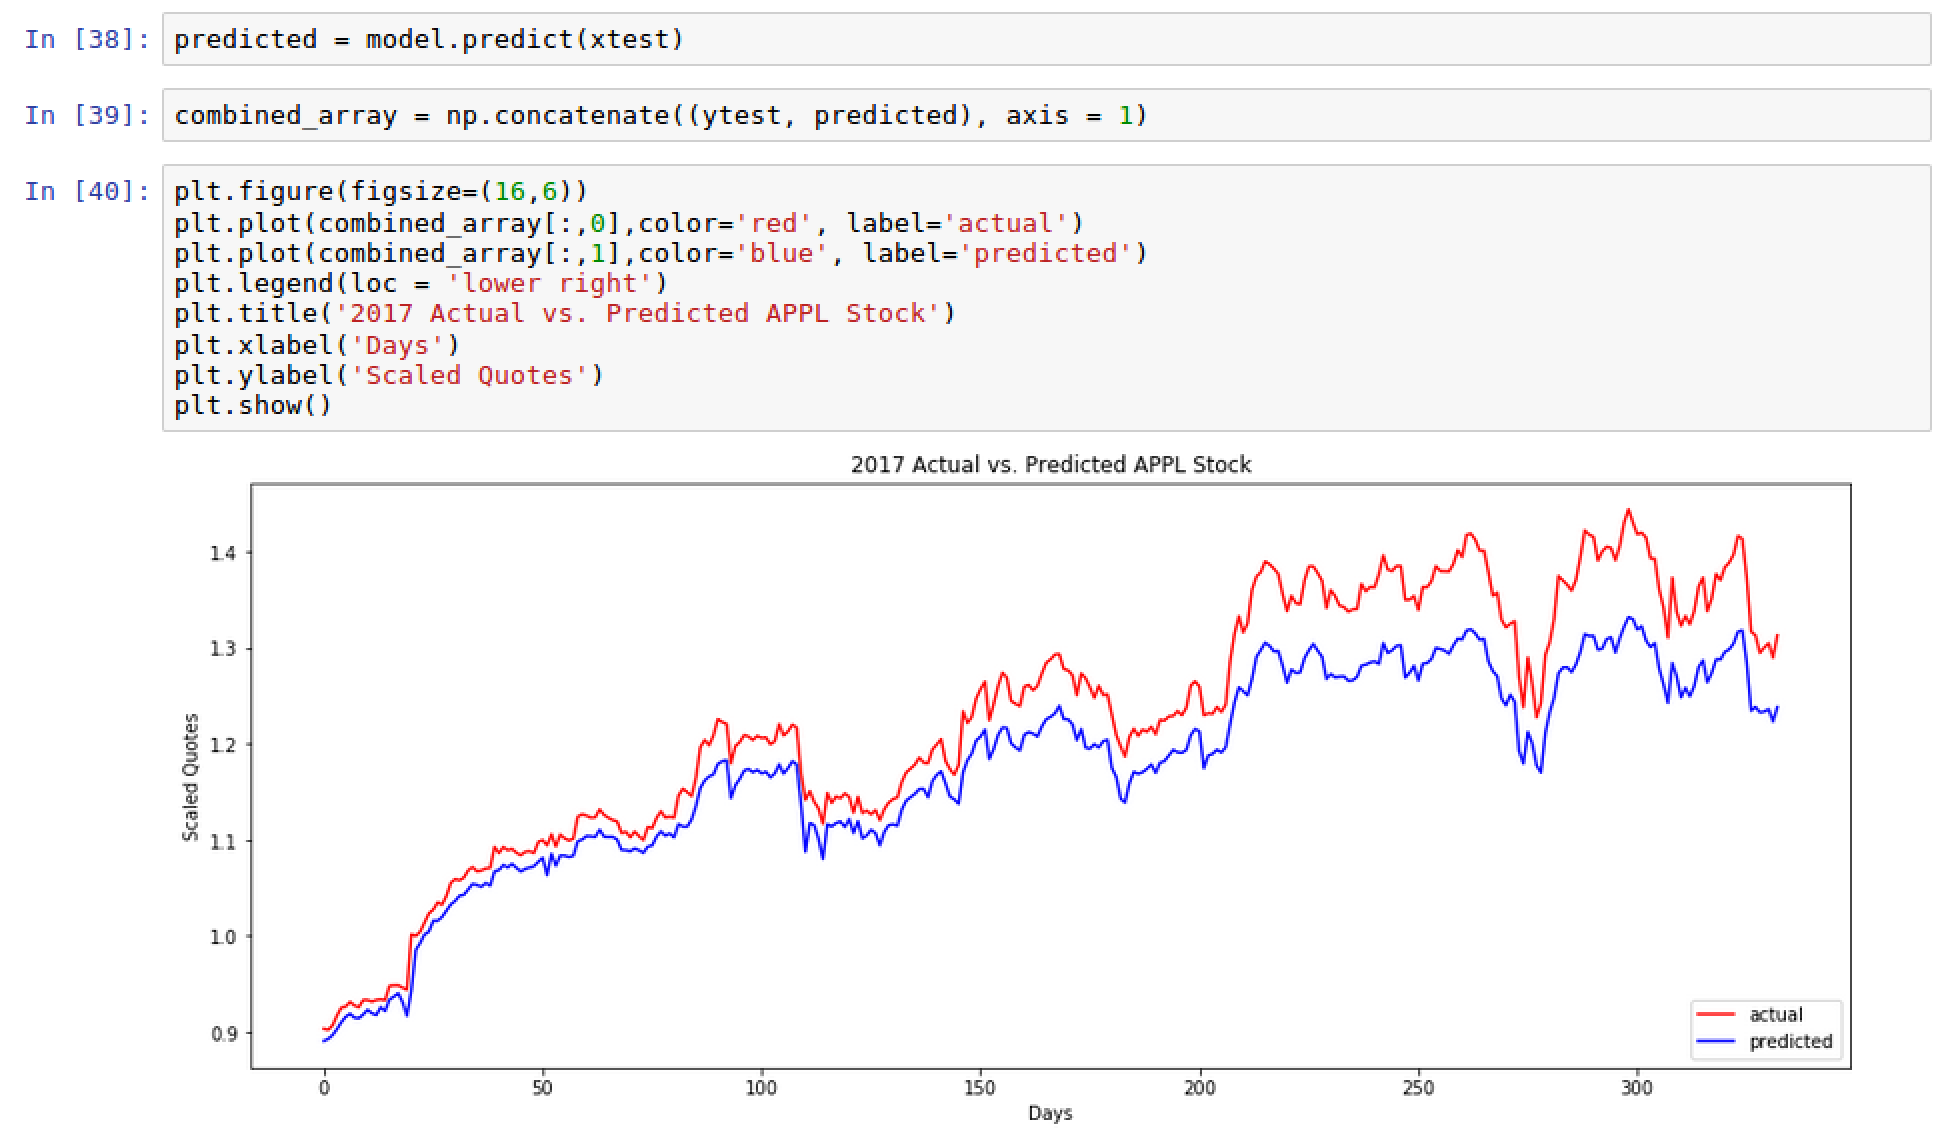
- From a graphical perspective, we can see that our predictions were close to the actual stock quotes from 2017-2018, as shown in the following screenshot:
- Our model shows that the predicted values are closer to the actual values earlier on in the days for 2017 and 2018 than later on. Overall, while it seems that our predicted and actual scores are very close, it would be best to get a mean squared error calculation to understand how much deviation is between the two. As we can see, we have a mean squared error of 0.05841 or approximately 5.8%: