This section explains how the Spark dataframe is converted to pandas and then plotted.
- A subset of the Spark dataframe is collected and converted to pandas using the toPandas() method in Spark.
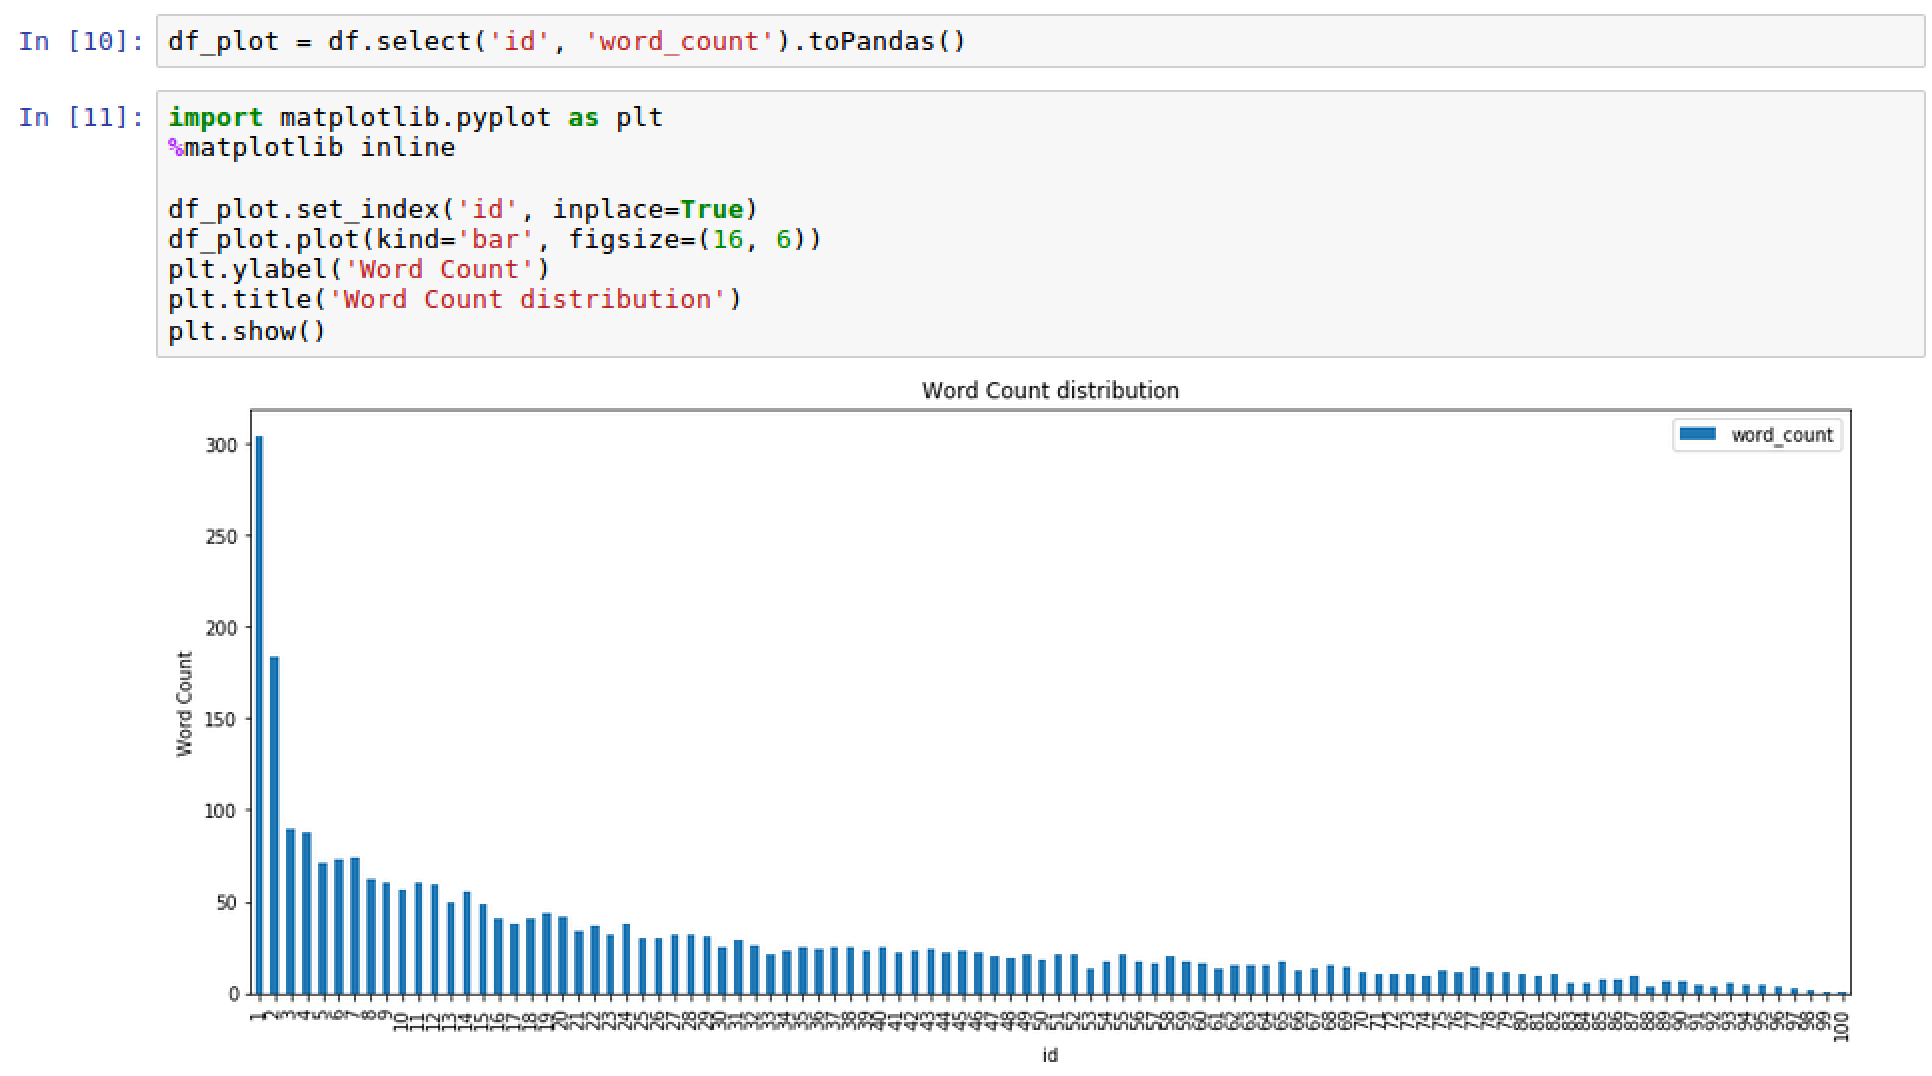
- That subset of data is then plotted using matplotlib setting the y-values to be word_count and the x-values to be the id as seen in the following screenshot: