The following section explains how we evaluate the model performance. Take a look at these images:
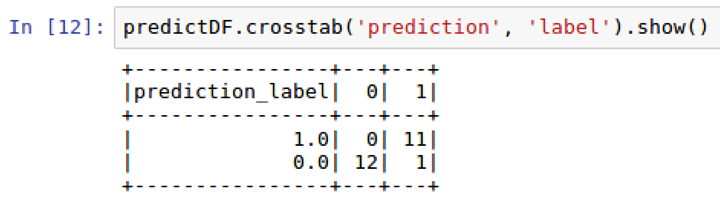
- We can convert our dataframe, predictDF, into a crosstab to create a confusion matrix. This allows us to understand how many true positives, false positives, true negatives, and false negatives are in our model, as seen in the following screenshot:
- At this point, we are ready to calculate how well we did with our model in using the 36 training images to accurately classify the 24 remaining test images of Ronaldo and Messi. From the previous screenshot, it shows that we had 21 accurate classifications out of 24. We had 2 images ...