This section explains how the model performance is evaluated.
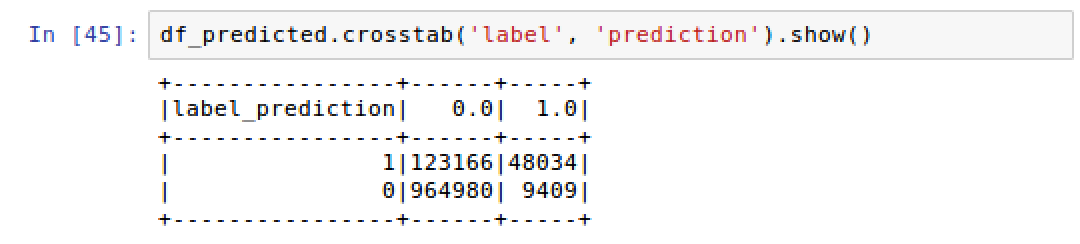
- In order to compute the accuracy of our model, it is important to be able to identify how accurate our predictions were. Often, this is best visualized using a confusion matrix cross table that shows correct and incorrect prediction scores. We create a confusion matrix using the crosstab() function off the df_predicted dataframe that shows us we have 964,980 true negative predictions for labels that are 0 and we have 48,034 true positive predictions for labels that are 1, as seen in the following screenshot:
- We know from earlier in this section that there are ...