September 2015
Beginner to intermediate
608 pages
13h 43m
English
We previously saw that a histogram of the UK election turnout was approximately normal (albeit with light tails). Now that we've loaded and transformed the Russian election data, let's see how it compares:
(defn ex-1-30 []
  (-> (i/$ :turnout (load-data :ru-victors))
      (c/histogram :x-label "Russia turnout"
                   :nbins 20)
      (i/view)))
The preceding example generates the following histogram:
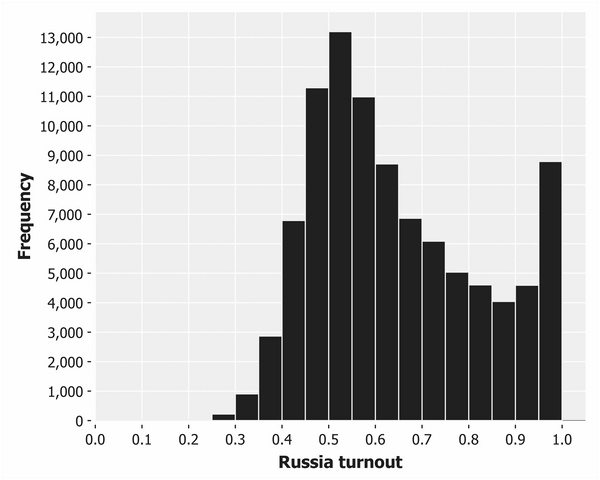
This histogram doesn't look at all like the classic bell-shaped curves we've seen so far. There's a pronounced positive skew, and the voter turnout actually increases from 80 percent towards 100 percent—the opposite of what we would expect ...
Read now
Unlock full access


