September 2015
Beginner to intermediate
608 pages
13h 43m
English
We can plot a histogram of dwell times by simply extracting the :dwell-time column with i/$:
(defn ex-2-2 []
  (-> (i/$ :dwell-time (load-data "dwell-times.tsv"))
      (c/histogram :x-label "Dwell time (s)"
                   :nbins 50)
      (i/view)))
The earlier code generates the following histogram:
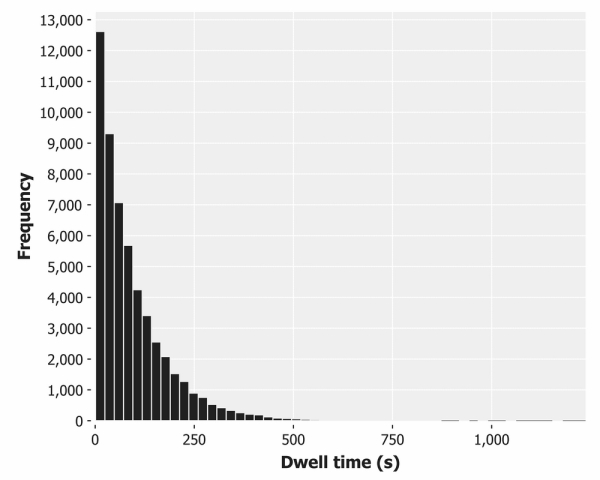
This is clearly not a normally distributed data, nor even a very skewed normal distribution. There is no tail to the left of the peak (a visitor clearly can't be on our site for less than zero seconds). While the data tails off steeply to the right at first, it extends much further along the x axis than we would expect from normally distributed data.
Read now
Unlock full access


