September 2015
Beginner to intermediate
608 pages
13h 43m
English
Let's remove the filter for weekdays and plot the daily mean dwell time for both week days and weekends:
(defn ex-2-12 []
  (let [means (->> (load-data "dwell-times.tsv")
                   (with-parsed-date)
                   (mean-dwell-times-by-date)
                   (i/$ :dwell-time))]
    (-> (c/histogram means
                     :x-label "Daily mean dwell time unfiltered (s)"
                     :nbins 20)
        (i/view))))
The code generates the following histogram:
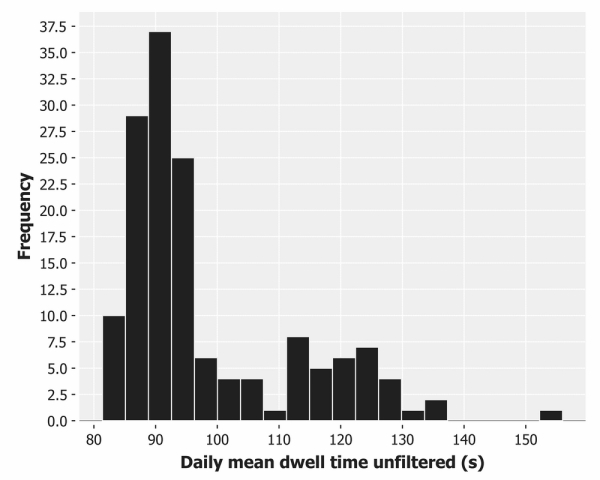
The distribution is no longer a normal distribution. In fact, the distribution is bimodal—there are two peaks. The second smaller peak, which corresponds to the newly added weekend data, is lower both because there are not as many weekend days as weekdays ...
Read now
Unlock full access


