June 2008
Intermediate to advanced
488 pages
15h 3m
English
By now, you must have noticed that there's a nice little command
prompt in Firebug that appears whenever the Console tab is selected. In
a nutshell, this little command prompt, shown in Figure A-6, will execute whatever
JavaScript you throw at it. Use it to test out JavaScript concepts, or
reach in and grab references to nodes for instant quick manipulation. In
particular, you can grab references to any content in the page through
JavaScript's document.getElementById
function. So what if an element doesn't have an id value—give it one yourself and be on your
merry way. From there, you might choose to use the console's built-in
console.dir (just like in Python) to
reveal methods available to it. Now would be a good time to divert to
Firebug's documentation (http://getfirebug.com/docs.html), where you'll find
details about console, incredibly
useful built-in functions like dir,
and more.
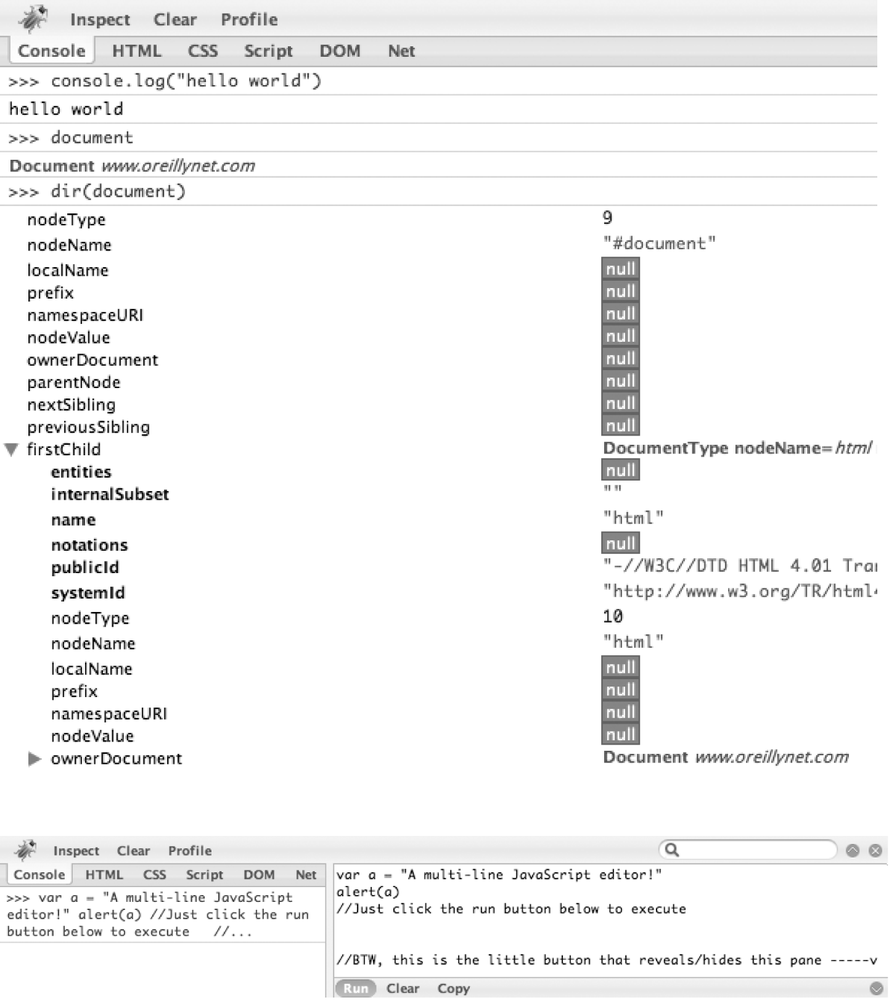
Figure A-6. Left: the console is your scripting interface into any web page; right: clicking the subtle button that looks like a ^ on the far right of the console prompt reveals a multiline JavaScript editor
Another contextual button that's visible while the Console tab is selected is Profile, and it does exactly what you'd think: profiles the execution of JavaScript in the page, as shown in Figure A-7. You simply click on it once to start profiling and click on it again to stop profiling and ...
Read now
Unlock full access


