November 2010
Intermediate to advanced
504 pages
12h 45m
English
We’re finally ready to draw a map of our new city. We’re using a standard format for our graph data, so writing this function is a breeze:
(defun draw-city ()
  (ugraph->png "city" *congestion-city-nodes* *congestion-city-edges*))
We created the ugraph->png function in the previous chapter, as part of our graph library.
Now call (new-game) from the REPL, and open the city.dot.png picture in your web browser:
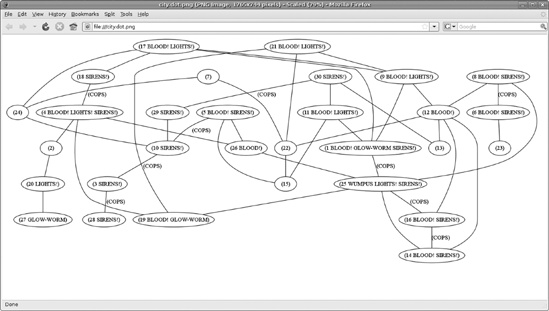
Since every city map created by our code is unique, your map will look completely different from the one in this picture.
Finally, we can marvel at the results of our urban planning!
Read now
Unlock full access


