March 2014
Beginner to intermediate
222 pages
4h 7m
English
Bar charts are a common staple of plotting package, and even matplotlib has them.
The dedicated function for bar charts is pyplot.bar(). We will enable this function by executing the following script:
import matplotlib.pyplot as plt

data = [5., 25., 50., 20.]

plt.bar(range(len(data)), data)
plt.show()
The preceding script will produce the following graph:
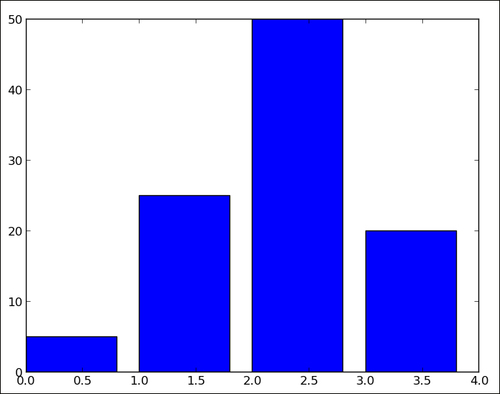
For each value in the list data, one vertical bar is shown. The pyplot.bar() function receives two arguments—the x coordinate for each bar and the height of each bar. Here, we use the coordinates 0, 1, 2, and so on, for each bar, which is the purpose ...
Read now
Unlock full access


