March 2014
Beginner to intermediate
222 pages
4h 7m
English
Stacked bar charts are of course possible by using a special parameter from the pyplot.bar() function.
The following script stacks two bar charts on each other:
import matplotlib.pyplot as plt

A = [5., 30., 45., 22.]
B = [5., 25., 50., 20.]

X = range(4)

plt.bar(X, A, color = 'b')
plt.bar(X, B, color = 'r', bottom = A)
plt.show()
The preceding script will produce the following graph:
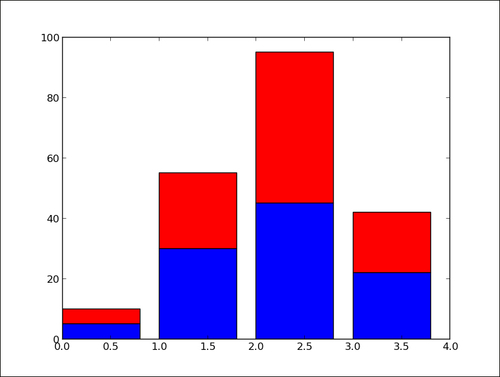
The optional bottom parameter of the pyplot.bar() function allows you to specify a starting value for a bar. Instead of running from zero to a value, it will go from the bottom to value. The first call to pyplot.bar() ...
Read now
Unlock full access


