March 2014
Beginner to intermediate
222 pages
4h 7m
English
Let's start with something simple: adding a title to a graphic.
The following code will add a title to the figure:
import numpy as np
import matplotlib.pyplot as plt

X = np.linspace(-4, 4, 1024)
Y = .25 * (X + 4.) * (X + 1.) * (X - 2.)

plt.title('A polynomial')
plt.plot(X, Y, c = 'k')
plt.show()
Here, we render a simple curve and add a title to the figure, which appears at the top of the figure:
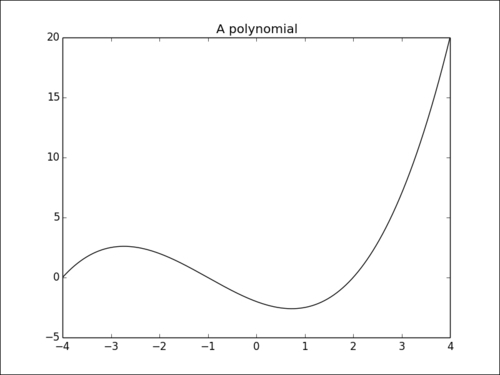
It's simply done with the pyplot.title()function, which takes one string as a parameter and sets the title for the whole figure.
Read now
Unlock full access


