March 2014
Beginner to intermediate
222 pages
4h 7m
English
So far, we have seen how to set text at preset locations, such as title and axes. In this recipe, we are going to see how to add text at any location using text boxes.
matplotlib has a very flexible function called pyplot.text(), that displays text:
import numpy as np
import matplotlib.pyplot as plt
X = np.linspace(-4, 4, 1024)
Y = .25 * (X + 4.) * (X + 1.) * (X - 2.)

plt.text(-0.5, -0.25, 'Brackmard minimum')

plt.plot(X, Y, c = 'k')
plt.show()
This script displays text next to a curve:
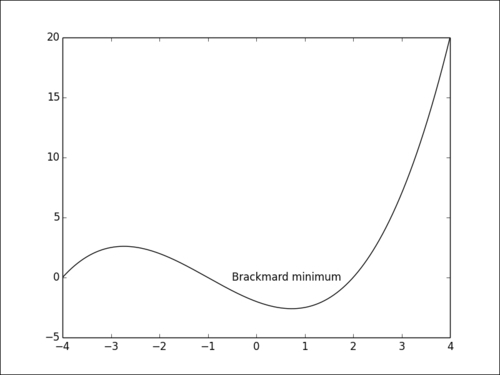
We use the pyplot.text() function that takes a position and the text to display. The position is given in the graphic coordinates, ...
Read now
Unlock full access


