March 2014
Beginner to intermediate
222 pages
4h 7m
English
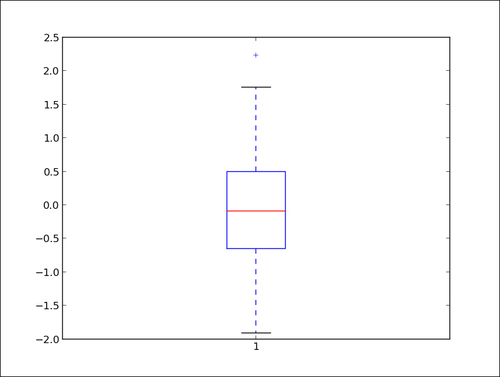
Boxplot allows you to compare distributions of values by conveniently showing the median, quartiles, maximum, and minimum of a set of values.
The following script shows a boxplot for 100 random values drawn from a normal distribution:
import numpy as np
import matplotlib.pyplot as plt

data = np.random.randn(100)

plt.boxplot(data)
plt.show()
A boxplot will appear that represents the samples we drew from the random distribution. Since the code uses a randomly generated dataset, the resulting figure will change slightly every time the script is run.
The preceding script will display the following graph:
Read now
Unlock full access


