March 2014
Beginner to intermediate
222 pages
4h 7m
English
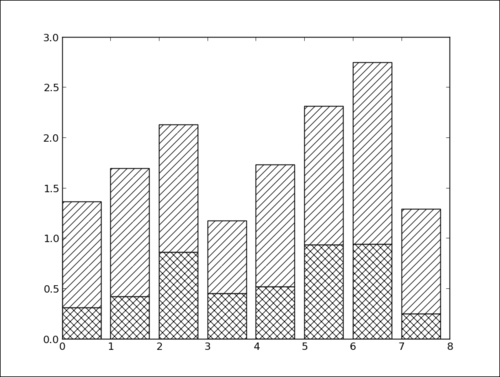
matplotlib offers fairly limited support to fill surfaces with a pattern. For line patterns, it can be helpful when preparing figures for black-and-white prints. In this recipe, we are going to look at how we can fill surfaces with a pattern.
Let's demonstrate the use of fill patterns with a bar chart as follows:
import numpy as np
import matplotlib.pyplot as plt

N = 8
A = np.random.random(N)
B = np.random.random(N)
X = np.arange(N)

plt.bar(X, A, color = 'w', hatch = 'x')
plt.bar(X, A + B, bottom = A, color = 'w', hatch = '/')

plt.show()
The preceding script produces the following graph:
Rendering ...
Read now
Unlock full access


