Working with Activities
There are a number of ways to visualize a schedule.
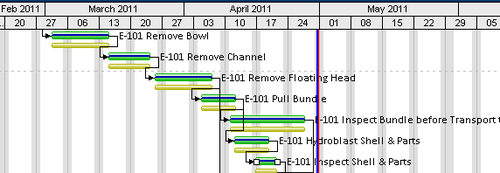
Gantt chart
The Gantt chart is what most people think about when visualizing a schedule. It is sometimes referred to as a bar chart, though that term has less specific meaning than Gantt chart.

Table
The table view
shows rows for each activity, and also optionally for each WBS. You may choose from among many different columns to display by pressing the icon, ![]() .
.

Activity network ...
Get Oracle Primavera P6 Version 8: Project and Portfolio Management now with the O’Reilly learning platform.
O’Reilly members experience books, live events, courses curated by job role, and more from O’Reilly and nearly 200 top publishers.

