6.4 IMPROVING NEWS ANALYTICS WITH AGGREGATION
6.4.1 Event studies
We used event studies as a means of systematic screening for interesting relationships between events defined using news analytics built using RNSE data. We were able to set, and vary thresholds (both absolute and relative) based on
- News intensity Number of news items in a period.
- Relevance Applicability of the items to a particular stock (0–100%).
- Sentiment scores Probability that a story is positive, negative, or neutral in tone for these items.
- Novelty and type of items Alerts, number of links to previous items, etc.
The time period for the event studies shown here is 2003–2008 with a universe of stocks based on the contemporaneous S&P 1500 over this period. Industry classifications are based on Thomson Reuters Business Classification (TRBC) sectors.
These studies are done on a daily timescale. The return intervals examined extend out to 60 days. Signals on this scale have a “slower alpha”, presumably due to the time it takes for people to accumulate information. This type of signal is amenable to large-position building and higher capacity funds.
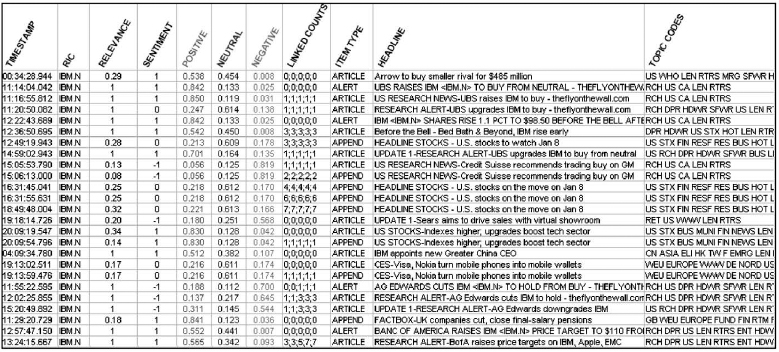
Figure 6.2. Sample RNSE data. Quantitative scores on qualitative information. Relevance measures how much the item is about a given company (e.g., a sector story mentioning many firms would have lower relevance for any of them than a single-company story). Sentiment ...
Get The Handbook of News Analytics in Finance now with the O’Reilly learning platform.
O’Reilly members experience books, live events, courses curated by job role, and more from O’Reilly and nearly 200 top publishers.

