May 2011
Beginner to intermediate
384 pages
12h 28m
English
Having cleaned the dataset, we were left with a sample of 90,000 news announcements from January 2001 onwards for companies within the S&P Large-Cap Europe universe (around 450 stocks). Figure 8.3 plots the time-series of news categories for a large-cap European universe. It shows that the majority of news items relate to company earnings news or guidance with the remainder equally split across other news categories. Figure 8.4 shows that news releases are not equally distributed across different calendar months. On average we find that just over half of all companies have some news reported each month, ranging from 30% at the beginning of the sample to 70% currently. We find that news stocks have a 60% chance of having more news in a subsequent month (be it good/bad news) and no-news stocks have a 30% chance.
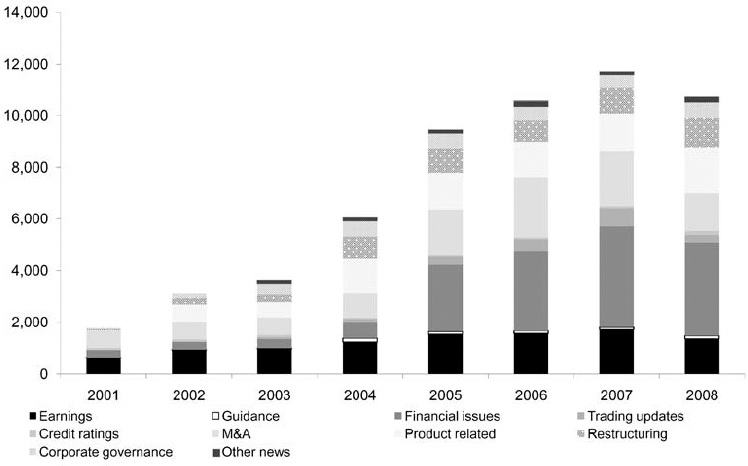
Figure 8.3. Categorizing news flow by year (source: RavenPack, Factiva, FactSet, Macquarie Quant Research).
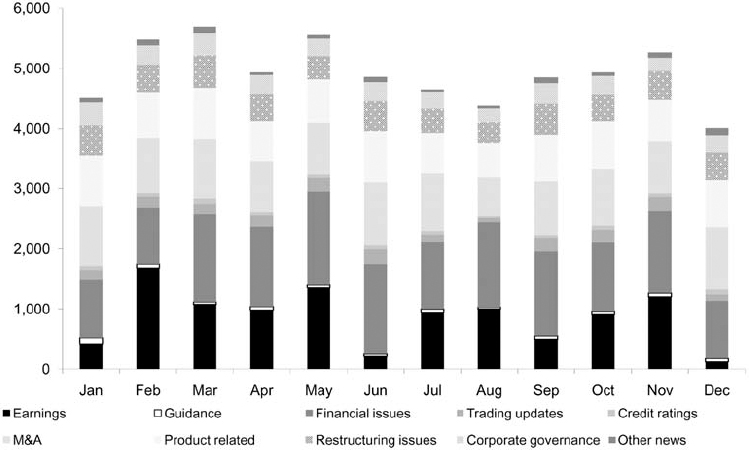
Figure 8.4. Categorizing news flow by month (source: RavenPack, Factiva, FactSet, Macquarie Quant Research).
We also find a statistically lower incidence of news reported on Fridays compared with the rest of the working week. Along a similar vein, academic research typically finds that Mondays and Fridays are light information days ...
Read now
Unlock full access


 O’Reilly covers everything we've got, with content to help us build a world-class technology community, upgrade the capabilities and competencies of our teams, and improve overall team performance as well as their engagement.I wanted to learn C and C++, but it didn't click for me until I picked up an O'Reilly book. When I went on the O’Reilly platform, I was astonished to find all the books there, plus live events and sandboxes so you could play around with the technology.I’ve been on the O’Reilly platform for more than eight years. I use a couple of learning platforms, but I'm on O'Reilly more than anybody else. When you're there, you start learning. I'm never disappointed.I'm always learning. So when I got on to O'Reilly, I was like a kid in a candy store. There are playlists. There are answers. There's on-demand training. It's worth its weight in gold, in terms of what it allows me to do.