7.3 SORT METHODOLOGY
7.3.1 Volume sorts
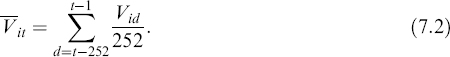
On the days when a stock experiences abnormally heavy volume, it is likely that investors are paying more attention to it than usual. We wish to test the extent to which the tendency to buy stocks increases on days of unusually high trading volume for each of our four investor groups (large discount, retail, small discount, and professional). First, we must sort stocks on the basis of abnormal trading volume. We do so by calculating for each stock on each trading day the ratio of the stock's trading volume that day to its average trading volume over the previous year (i.e., 252 trading days). Thus, we define abnormal trading volume for stock i on day t, AVit to be
![]()
where Vit is the dollar volume for stock i traded on day t as reported in the Center for Research in Security Prices (CRSP) daily stock return files for New York Stock Exchange (NYSE), American Stock Exchange (ASE), and NASDAQ stocks and
Each day we sort stocks into deciles on the basis of that day's abnormal trading volume.11 We further subdivide the decile of stocks with the greatest abnormal trading volume into two vingtiles (i.e., 5% partitions). Then, for each of our investor types, we sum the buys (B) and sells (S) of stocks in each volume partition on day t and calculate ...
Get The Handbook of News Analytics in Finance now with the O’Reilly learning platform.
O’Reilly members experience books, live events, courses curated by job role, and more from O’Reilly and nearly 200 top publishers.

