Test Management has an option to generate a test execution burndown chart, with the help of which the rate of test execution can be tracked:
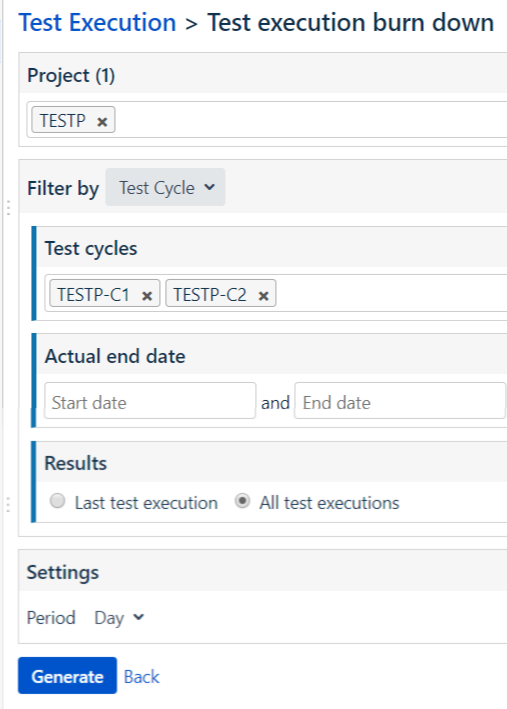
- In order to generate a test execution burndown chart in the Test Management tool, navigate to the Tests | Reports | Test execution tab, and select the Test execution burn down option. This shows the configuration page.
- Enter the details, select the duration of the report, and click on the Generate button:
- This generates the following report, which indicates the rate of the daily execution of the test cases for the two selected test cycles. The y axis indicates the total number of the ...


