February 2019
Intermediate to advanced
264 pages
6h 22m
English
Zephyr has an option to generate a test execution burndown chart, which helps a team to understand the status of the current test execution phase:
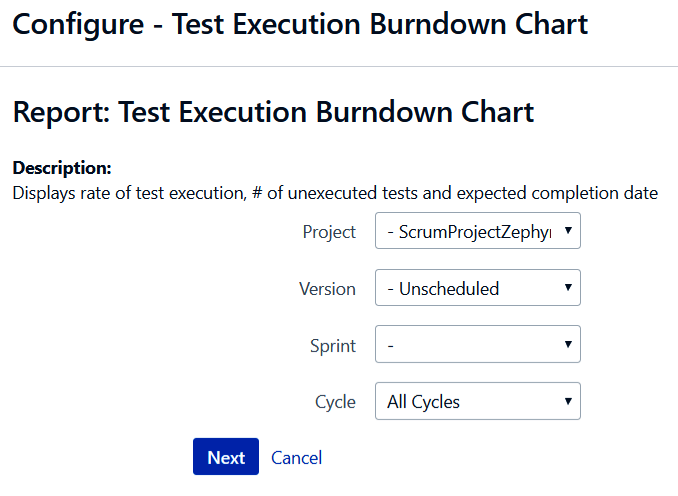
This generates the following graph. The graph indicates the Average rate of execution, the Total unexecuted tests remaining, and the Expected completion date:
In this case, these values are as follows:
Read now
Unlock full access


