5.6 VD Estimated for Real Hyperspectral Images
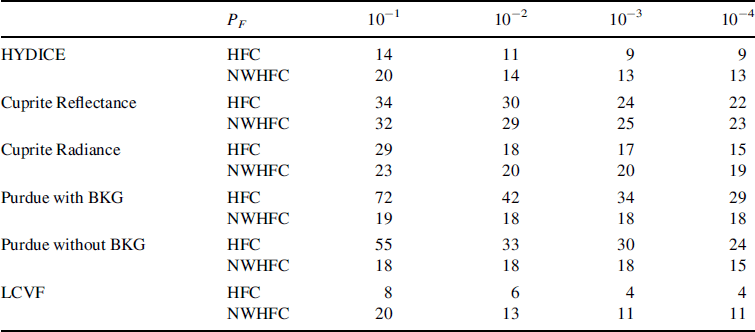
To conclude this chapter, this section presents experiments based on real image scenes described in Section 1.7 of Chapter 1. According to the experimental results for synthetic images in Section 5.5, only the HFC and NWHFC methods from data characterization-driven criteria have been shown to be effective. Therefore, Table 5.8 tabulates the values of VD estimated by the HFC and NWHFC methods for three AVIRIS data sets: Cuprite data (reflectance and radiance data), Purdue data with/out background (BKG), LCVF data, plus a 15-panel HYDICE data.
Table 5.8 VD estimated for real images by HFC and NWHFC.

As for data representation-driven criteria Table 5.9 tabulates the values of VD estimated by SSE and HySime for Cuprite data (reflectance and radiance data), Purdue data with/out background (BKG), LCVF data, and 15-panel HYDICE data.
Table 5.9 VD estimated for real images by SSE and HySime.
| SSE | HySime | |
| HYDICE | 10 | 20 |
| Cuprite reflectance | 27 | 16 |
| Cuprite radiance | 18 | 17 |
| Purdue with BKG | 8 | 13 |
| Purdue without BKG | 7 | 13 |
| LCVF | 12 | 11 |
Comparing VD estimated by HFC/NWHFC in Table 5.8 to the VD estimated by SSE/HySime in Table 5.9, the SSE/HySime-estimated values were found to be within the ranges of HFC/NWHFC-estimated VD values except the Purdue data with PF set to around 10−3. It is known that the samples in Purdue data are heavily mixed. ...
Get Hyperspectral Data Processing: Algorithm Design and Analysis now with the O’Reilly learning platform.
O’Reilly members experience books, live events, courses curated by job role, and more from O’Reilly and nearly 200 top publishers.

