December 2018
Beginner to intermediate
682 pages
18h 1m
English
By default, the highlight_max method highlights the maximum value of each column. We can use the axis parameter to highlight the maximum value of each row instead. Here, we select just the race percentage columns of the college dataset and highlight the race with the highest percentage for each school:
>>> college = pd.read_csv('data/college.csv', index_col='INSTNM')>>> college_ugds = college.filter(like='UGDS_').head()>>> college_ugds.style.highlight_max(axis='columns')
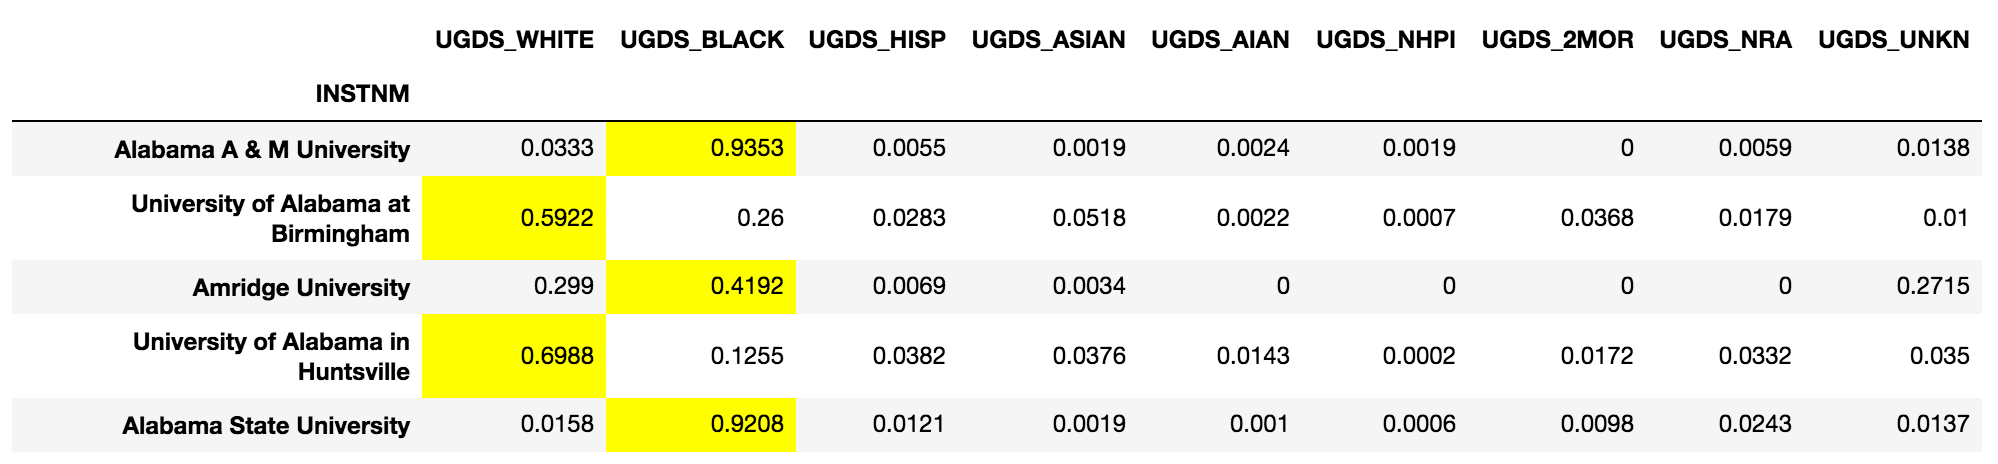
Attempting to apply a style on a large DataFrame can cause Jupyter to crash, which is why the style was only applied to the head of the DataFrame.
Read now
Unlock full access


