December 2018
Beginner to intermediate
682 pages
18h 1m
English
In the population example, the raw data was already binned into different age groups. What if the data is not binned (for example, the BigMac Index data)? Turns out, seaborn.distplot can help us to process the data into bins and show us a histogram as a result. Let's look at this example:
import seaborn as snsimport matplotlib.pyplot as plt# Get the BigMac index in 2017current_bigmac = bigmac_df[(bigmac_df.Date == "2017-01-31")]# Plot the histogramax = sns.distplot(current_bigmac.dollar_price)plt.show()
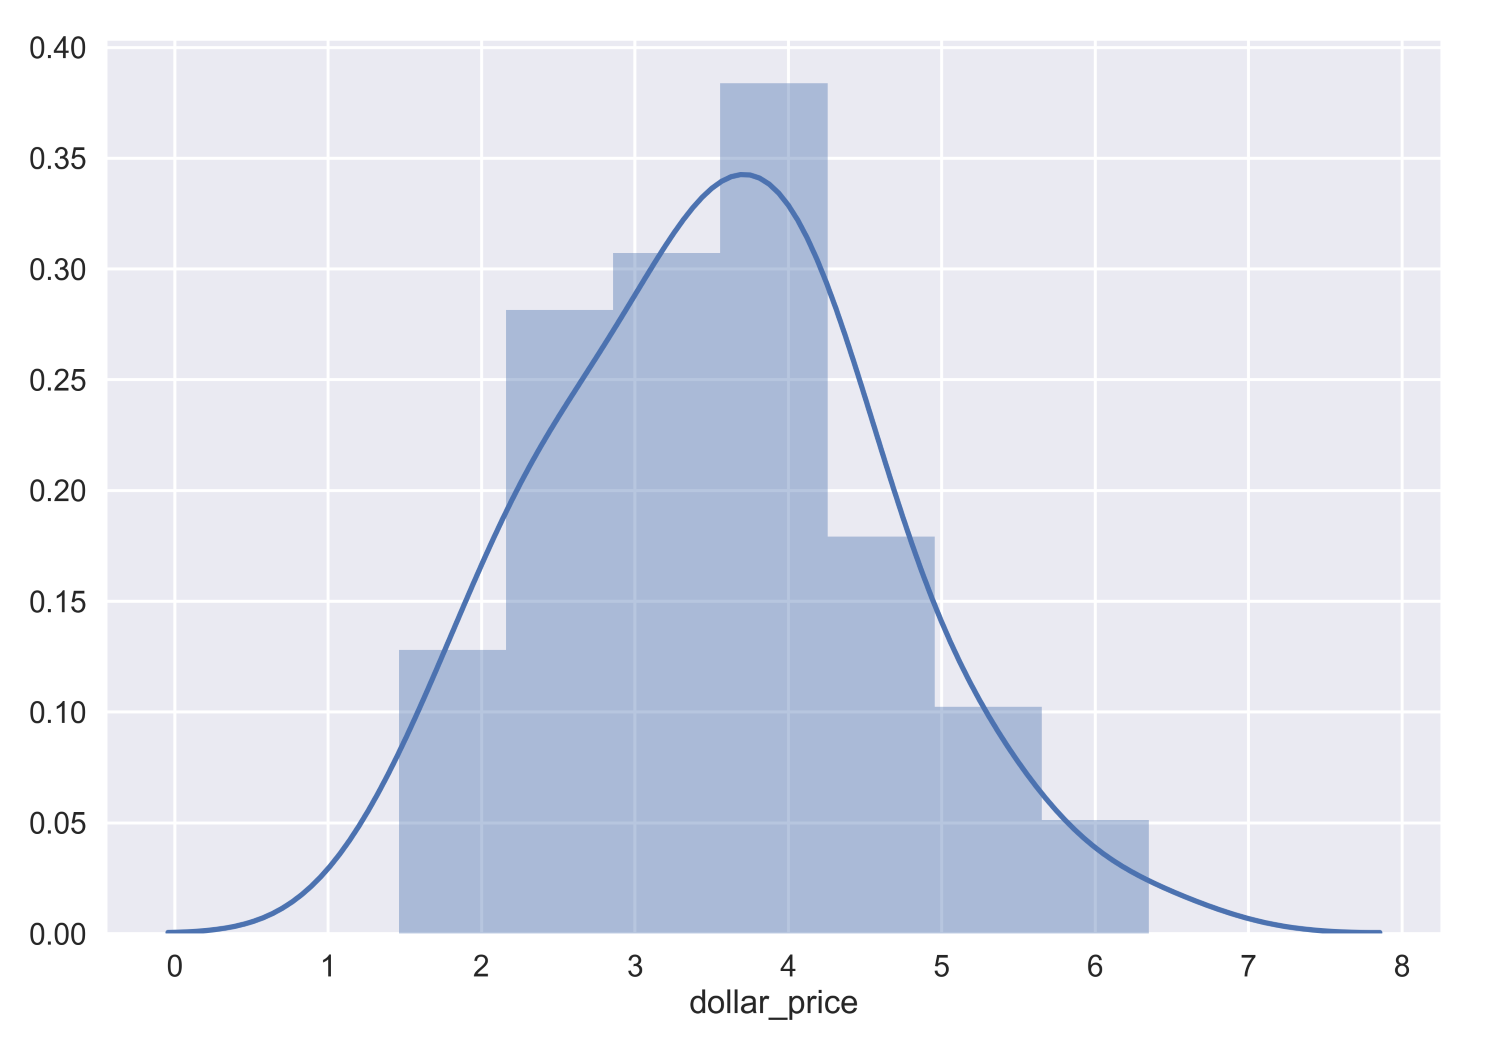
The seaborn.distplot function expects either pandas Series, single-dimensional numpy.array, ...
Read now
Unlock full access


