THE LINK BETWEEN EARNINGS AND RETURNS
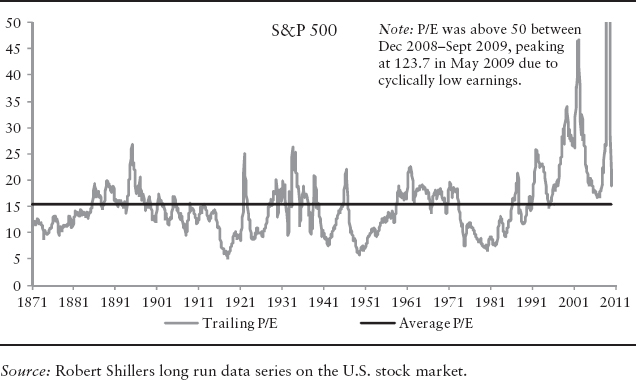
The P/E multiple that investors put on current earnings when valuing them, as well as other commonly used valuation metrics, shift significantly over time. Exhibit 5.1 shows the U.S. trailing P/E multiple since 1871. As can be seen, there is both a cyclical component to the changes in the multiple as well as movements at lower frequencies. The P/E multiple stayed below long term averages for most of the 1970s and above for a big part of the 1990s.
There are many potential reasons for these movements in the P/E ratio. One way to think about these drivers is to use a simple dividend discount model (DDM) with constant growth rates to measure the fair value of the market. In such a model, we have that
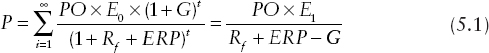
where P is the theoretical market price, E0 is the level of earnings over the last year, E1 is the level of earnings over the next year, PO is the payout ratio, Rf is the nominal risk-free interest rate, ERP is the equity risk premium, and G is the nominal growth rate.
Dividing through by E gives
![]()
EXHIBIT 5.1 The P/E Multiple has both Cyclical and Lower Frequency Movements
Therefore, changes in the P/E multiple over time could arise from changes in payout ...
Get Equity Valuation and Portfolio Management now with the O’Reilly learning platform.
O’Reilly members experience books, live events, courses curated by job role, and more from O’Reilly and nearly 200 top publishers.

