May 2008
Intermediate to advanced
320 pages
7h
English
NOTE
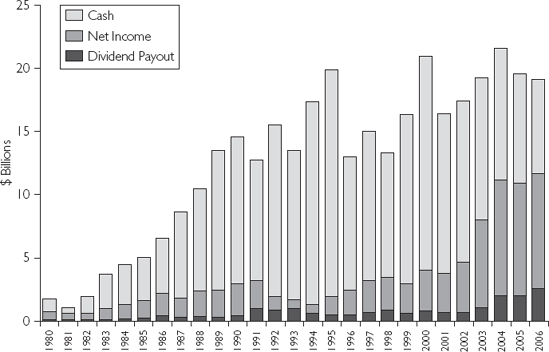
Dividend payout calculated from net income times payout ratio.
Source: Figures for cash, net income, and payout ratio for 1980 to 2006 from Thomson One Banker Analytics, February 26, 2007.
NOTE
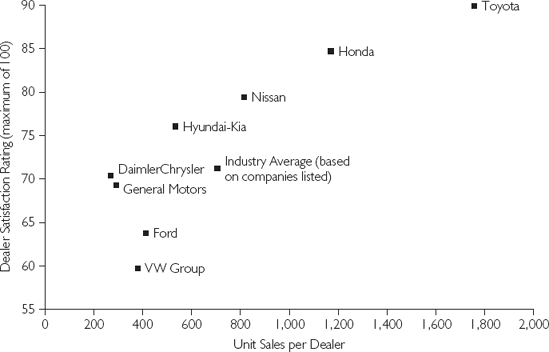
Toyota's dealers led the fi eld with sales averaging 1,760 units per dealer and a Dealer Satisfaction Rating of 90, ahead of Honda (1,173 units per dealer, rating of 84.7) and Nissan (815 units per dealer, rating of 79.4). The industry average was 705 units per dealer and a rating of 71.2. Dealer satisfaction ratings are based on the average of a carmaker's brands. For example, Toyota had 221 Lexus dealers with a dealer satisfaction rating of 96, 991 Scion dealers with a rating of 90.9, and 1,224 Toyota dealers with a rating of 88.1. The average dealer satisfaction is the sum of each brand's dealer rating times the number of dealers, divided by the overall number of dealers. The result for Toyota is an average dealer satisfaction rating of 90.
Source: Author analysis of 2006 Dealer Attitude Survey (McLean, VA: North American Dealers Association, ...
Read now
Unlock full access


