July 2008
Intermediate to advanced
1026 pages
27h 59m
English
As applications grow in complexity, it is quite common for the execution path to become difficult to follow. The use of deep inheritance trees and interfaces can often obscure the execution path. This is where the call stack is useful. Each path of execution must have a finite number of entries on the stack (unless a cyclic pattern emerges, in which case a stack overflow is inevitable). The stack can be viewed using the Call Stack window, shown in Figure 41-8.
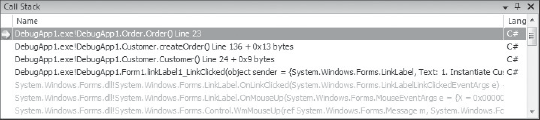
Using the Call Stack window, it is easy to navigate up the execution path to determine from where the current executing method is being called. This can be done by clicking any of the rows in the call stack, known as a stack frame. Other options available from the call stack, using the right-click context menu, enable viewing the disassembler for a particular stack frame, setting breakpoints, and varying what information is displayed.
Read now
Unlock full access


 O’Reilly covers everything we've got, with content to help us build a world-class technology community, upgrade the capabilities and competencies of our teams, and improve overall team performance as well as their engagement.I wanted to learn C and C++, but it didn't click for me until I picked up an O'Reilly book. When I went on the O’Reilly platform, I was astonished to find all the books there, plus live events and sandboxes so you could play around with the technology.I’ve been on the O’Reilly platform for more than eight years. I use a couple of learning platforms, but I'm on O'Reilly more than anybody else. When you're there, you start learning. I'm never disappointed.I'm always learning. So when I got on to O'Reilly, I was like a kid in a candy store. There are playlists. There are answers. There's on-demand training. It's worth its weight in gold, in terms of what it allows me to do.